Free Access
Fig. 6
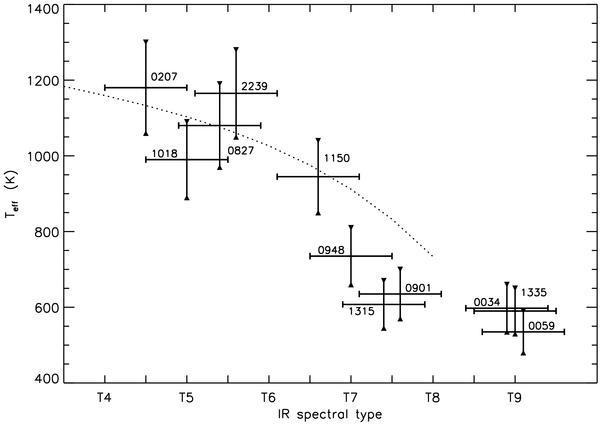
Temperature ranges plotted as a function of the spectral type. Uncertainties in each extreme point of the range are in Table 6. The uncertainty in spectral type is half subtype. The over plotted dotted line is the effective temperature-infrared type relation derived by Stephens et al. (2009).
Current usage metrics show cumulative count of Article Views (full-text article views including HTML views, PDF and ePub downloads, according to the available data) and Abstracts Views on Vision4Press platform.
Data correspond to usage on the plateform after 2015. The current usage metrics is available 48-96 hours after online publication and is updated daily on week days.
Initial download of the metrics may take a while.