Fig. 6
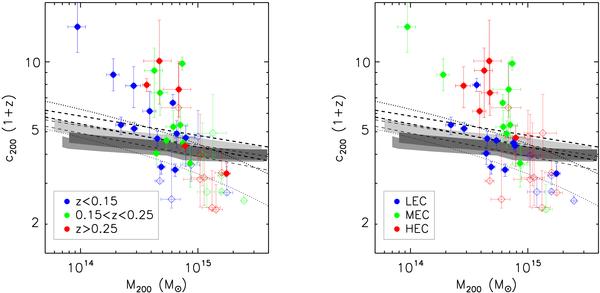
Data in the plane (c200,M200) used to constrain the cosmological parameters (Ωm,σ8). The dotted lines show the predicted relations from Eke et al. (2001) for a given ΛCDM cosmological model at z = 0 (from top to bottom: σ8 = 0.9 and σ8 = 0.7). The shaded regions show the predictions in the redshift range 0.1 − 0.3 for an assumed cosmological model in agreement with WMAP-1, 5 and 3 years (from the top to the bottom, respectively) from Bullock et al. (2001; after Macciò et al. 2008). The dashed lines indicate the best-fit range at 1σ obtained for relaxed halos in a WMAP-5 years cosmology from Duffy et al. (2008; thin lines: z = 0.1, thick lines: z = 0.3). Color codes and symbols as in Fig. 5.
Current usage metrics show cumulative count of Article Views (full-text article views including HTML views, PDF and ePub downloads, according to the available data) and Abstracts Views on Vision4Press platform.
Data correspond to usage on the plateform after 2015. The current usage metrics is available 48-96 hours after online publication and is updated daily on week days.
Initial download of the metrics may take a while.