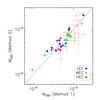
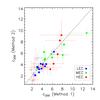
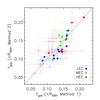
Fig. 5
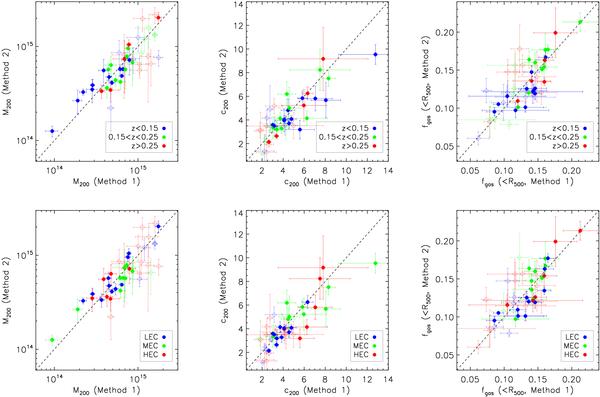
Estimates of M200 (left), c200 (center) and fgas(<R500) (right) with the two methods. (Upper panels) The color code indicates the objects at z < 0.15 (blue), in the range 0.15 < z < 0.25 (green) and at z > 0.25 (red). (Lower panels) Distribution of Low (LEC), Medium (MEC), High (HEC) Entropy Core systems.
Current usage metrics show cumulative count of Article Views (full-text article views including HTML views, PDF and ePub downloads, according to the available data) and Abstracts Views on Vision4Press platform.
Data correspond to usage on the plateform after 2015. The current usage metrics is available 48-96 hours after online publication and is updated daily on week days.
Initial download of the metrics may take a while.