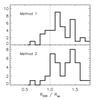
Fig. 3
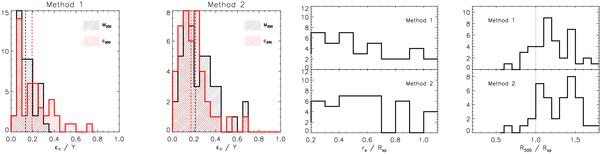
(First 2 panels on the left) Relative errors on M200 (black) and c200 (red) estimated by the two methods. The median values are indicated by a dashed line. (3rd and 4th panel from left) Ratios between the best-fit result on the scale radius rs (3rd panel) and on R500 (4th panel) and outermost radius reached with the spatial analysis.
Current usage metrics show cumulative count of Article Views (full-text article views including HTML views, PDF and ePub downloads, according to the available data) and Abstracts Views on Vision4Press platform.
Data correspond to usage on the plateform after 2015. The current usage metrics is available 48-96 hours after online publication and is updated daily on week days.
Initial download of the metrics may take a while.