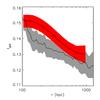
Fig. 2
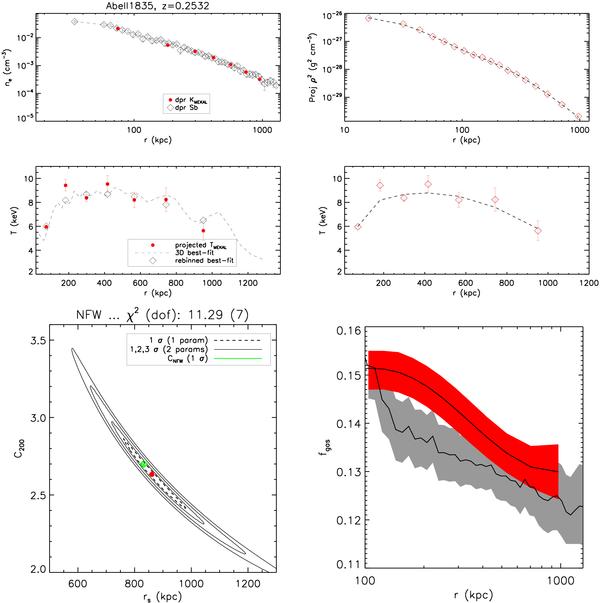
Example of the results of the two analyses adopted for the mass reconstruction.
(Top and middle panels, left) Gas density profile as obtained
from the deprojection of the surface brightness profile compared to the one
recovered from the deprojection of the normalizations of the thermal model in the
spectral analysis; observed temperature profile with overplotted the best-fit model
(from Method 1). (Top and middle panels, right)
Data (diamonds) and models (dashed lines) of the projected gas density
squared and temperature (from Method 2). (Bottom, left)
Constraints in the rs − c
plane with the prediction (in green) obtained by imposing the relation
 from M08. (Bottom, right) Gas mass fraction profile obtained from
Method 1 (gray) and Method 2 (red).
from M08. (Bottom, right) Gas mass fraction profile obtained from
Method 1 (gray) and Method 2 (red).
Current usage metrics show cumulative count of Article Views (full-text article views including HTML views, PDF and ePub downloads, according to the available data) and Abstracts Views on Vision4Press platform.
Data correspond to usage on the plateform after 2015. The current usage metrics is available 48-96 hours after online publication and is updated daily on week days.
Initial download of the metrics may take a while.