Fig. 1
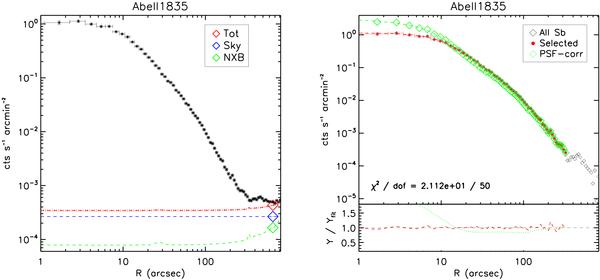
(Left) Surface brightness profile in the 0.7−1.2 keV band (black filled circles) of Abell1835 compared with the profiles of the background components. The open diamonds show the count rate predicted from the background spectral model in the annulus 10–12 arcmin and rescaled for the mean vignetting correction of 0.472 at those radii: the instrumental component (NXB; green), the photon component (CXB + galactic foregrounds; blue) and the total background (sky + instrumental; red). The dashed lines show the background profiles that we have used in our analysis: the “photon” background (blue), which is constant and corresponds to the value in the outer annulus rescaled to the center, and the instrumental background profile (green), increasing with radius in order to consider the over-correction of this component. The red dashed line shows the total background that we have subtracted from our source plus background profile, with its associated one σ statistical error (red dotted lines) obtained with a Monte Carlo simulation. Note that the intensity of the background components and their relative contribution vary significantly from cluster to cluster. (Right) Example of the PSF-corrected background-subtracted surface brightness profile as obtained after the analysis outlined in Sect. 2.2. This example refers to Abell1835, one of the objects with the largest smearing effect due to the combination of the telescope’s PSF and the centrally peaked intrinsic profile.
Current usage metrics show cumulative count of Article Views (full-text article views including HTML views, PDF and ePub downloads, according to the available data) and Abstracts Views on Vision4Press platform.
Data correspond to usage on the plateform after 2015. The current usage metrics is available 48-96 hours after online publication and is updated daily on week days.
Initial download of the metrics may take a while.