Fig. 8
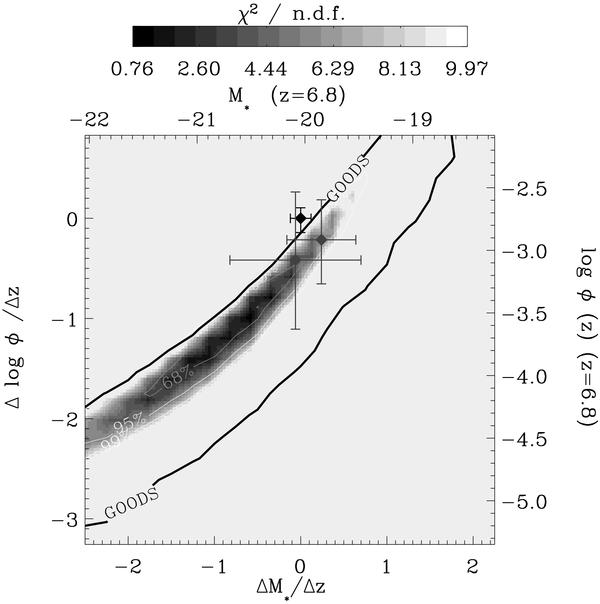
χ2 contour levels for the dlog (φ)/dz,  parameters derived for the Schechter–like LF considering all four Hawk-I fields. The lower and left axis refer to the evolutionary terms and dlog (φ)/dz with respect to the best-fit z = 6 parameters of McLure et al. (2009) (black point and errorbars). The upper and right axis refer to the M ∗ and φ values at the median redshift estimated for our sample (z = 6.8). Grey points and errorbars mark the position of the z ~ 7 best-fit parameters by Ouchi et al. (2009a) and by Bouwens et al. (2008). The black solid line indicates the 99% c.l. region estimated on the basis of the two GOODS-South pointings only (C10).
Current usage metrics show cumulative count of Article Views (full-text article views including HTML views, PDF and ePub downloads, according to the available data) and Abstracts Views on Vision4Press platform.
Data correspond to usage on the plateform after 2015. The current usage metrics is available 48-96 hours after online publication and is updated daily on week days.
Initial download of the metrics may take a while.