Fig. 7
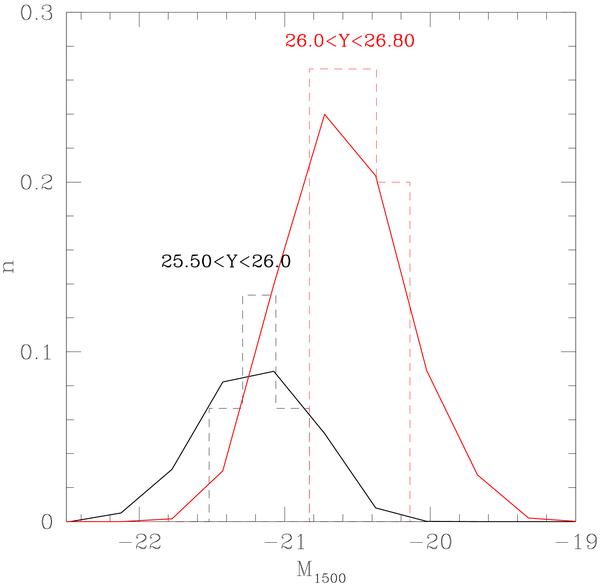
Normalized distribution of UV continuum magnitudes (estimated from the average Y − M1500 relation) for the 15 Hawk-I candidates divided in two bins (dashed histograms). The solid curves show the expected distributions of UV magnitudes for objects in the same observed ranges when photometric uncertainties are taken into account through Monte Carlo simulations.
Current usage metrics show cumulative count of Article Views (full-text article views including HTML views, PDF and ePub downloads, according to the available data) and Abstracts Views on Vision4Press platform.
Data correspond to usage on the plateform after 2015. The current usage metrics is available 48-96 hours after online publication and is updated daily on week days.
Initial download of the metrics may take a while.