Fig. 2
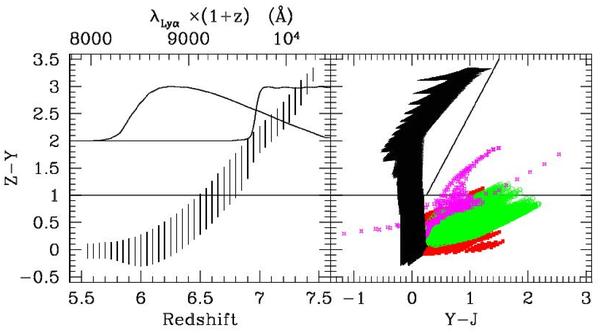
Left: Z − Y colour of star-forming galaxies as a function of redshift. In the upper part, the efficiency curve of the two filters is shown, computed at the observed wavelength of a Lyman-α emission at the corresponding redshift. Right: Z − Y vs. Y − J colour diagram showing the expected colours of LBGs (same as in left panel, black points), passively evolving galaxies (red squares) and reddened starbursts (green circles) at 1.5 < z < 4 and cool dwarf stars from the templates of Tsuji et al. (2004) (magenta stars). Galaxy colours are computed according to CB07 models, see text for details on the adopted parameters. In both panels the lines indicate the relevant colour selection criteria discussed in Sect. 3
Current usage metrics show cumulative count of Article Views (full-text article views including HTML views, PDF and ePub downloads, according to the available data) and Abstracts Views on Vision4Press platform.
Data correspond to usage on the plateform after 2015. The current usage metrics is available 48-96 hours after online publication and is updated daily on week days.
Initial download of the metrics may take a while.