Free Access
Fig. 8
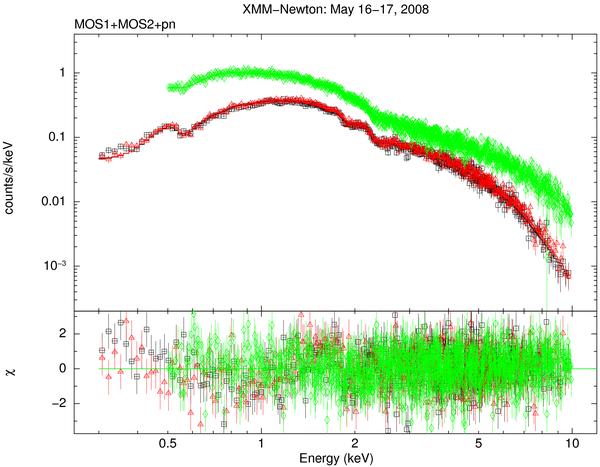
EPIC spectrum of BL Lacertae on 2008 May 16–17; black squares, red triangles, and green diamonds represent MOS1, MOS2, and pn data, respectively. The bottom panel shows the deviations of the observed data from the folded model (a double power law with fixed absorption) in units of standard deviations.
Current usage metrics show cumulative count of Article Views (full-text article views including HTML views, PDF and ePub downloads, according to the available data) and Abstracts Views on Vision4Press platform.
Data correspond to usage on the plateform after 2015. The current usage metrics is available 48-96 hours after online publication and is updated daily on week days.
Initial download of the metrics may take a while.