Fig. 4
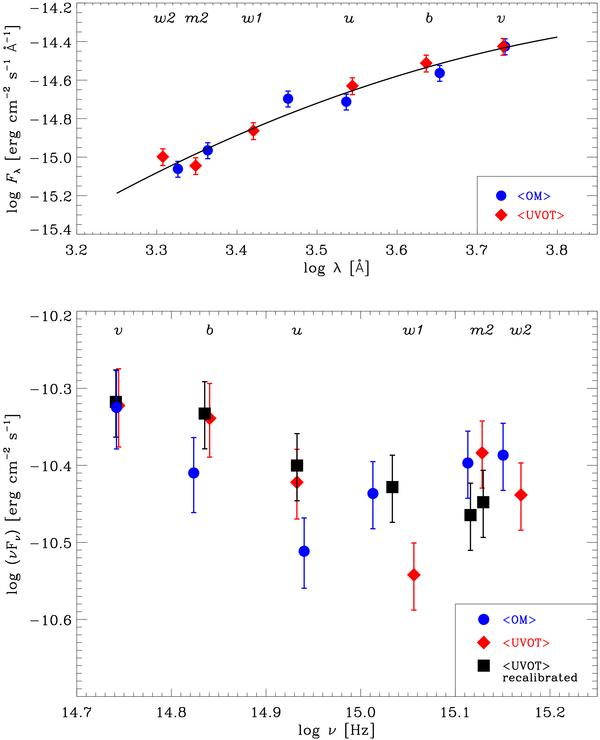
Top: observed spectrum of BL Lacertae in the optical-UV band. Red diamonds refer to the mean UVOT spectrum resulting from 16 epochs analysed in this paper. Blue circles represent the average spectrum obtained from the three observations of the OM instrument onboard XMM-Newton in 2007–2008 (Raiteri et al. 2009), normalised to the mean UVOT spectrum in the v band. The solid line is the log-parabolic fit used in the calibration procedure. Bottom: optical-UV SEDs of BL Lacertae. Blue circles and red diamonds are derived from the OM and UVOT average spectra shown in the top panel by using standard prescriptions to obtain dereddened flux densities. Black squares represent the mean UVOT SED after recalibration as explained in the text. In both panels the filter labels are centred on the standard UVOT λeff (Poole et al. 2008).
Current usage metrics show cumulative count of Article Views (full-text article views including HTML views, PDF and ePub downloads, according to the available data) and Abstracts Views on Vision4Press platform.
Data correspond to usage on the plateform after 2015. The current usage metrics is available 48-96 hours after online publication and is updated daily on week days.
Initial download of the metrics may take a while.