Fig. 3
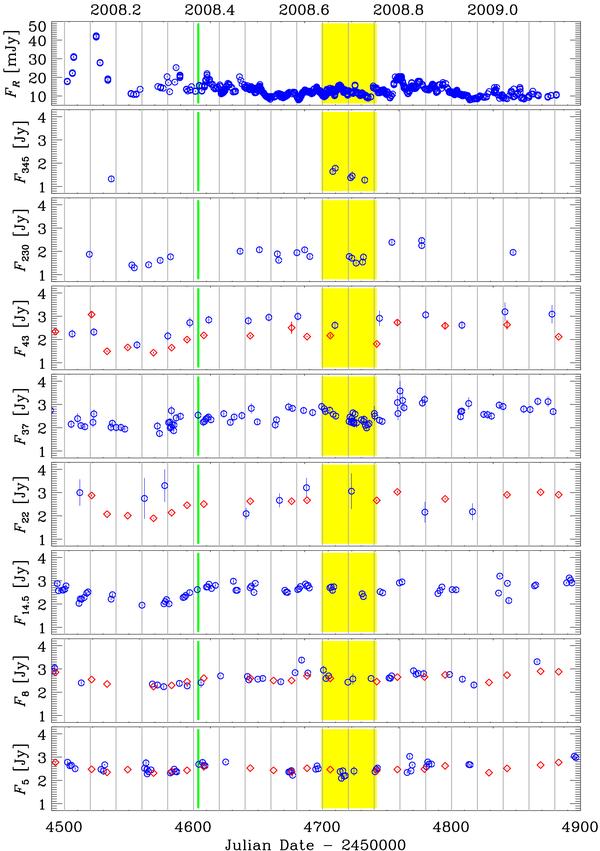
Optical flux densities (R band, top panel), after correction for Galactic extinction and host galaxy contamination, compared to radio flux densities at different frequencies. Blue circles represent GASP data; red diamonds indicate data from the VLA/VLBA PCD. The vertical green line corresponds to the XMM-Newton pointing of May 16–17; the yellow strip highlights the period of Swift observations, from 2008 August 20 to October 2.
Current usage metrics show cumulative count of Article Views (full-text article views including HTML views, PDF and ePub downloads, according to the available data) and Abstracts Views on Vision4Press platform.
Data correspond to usage on the plateform after 2015. The current usage metrics is available 48-96 hours after online publication and is updated daily on week days.
Initial download of the metrics may take a while.