Fig. 2
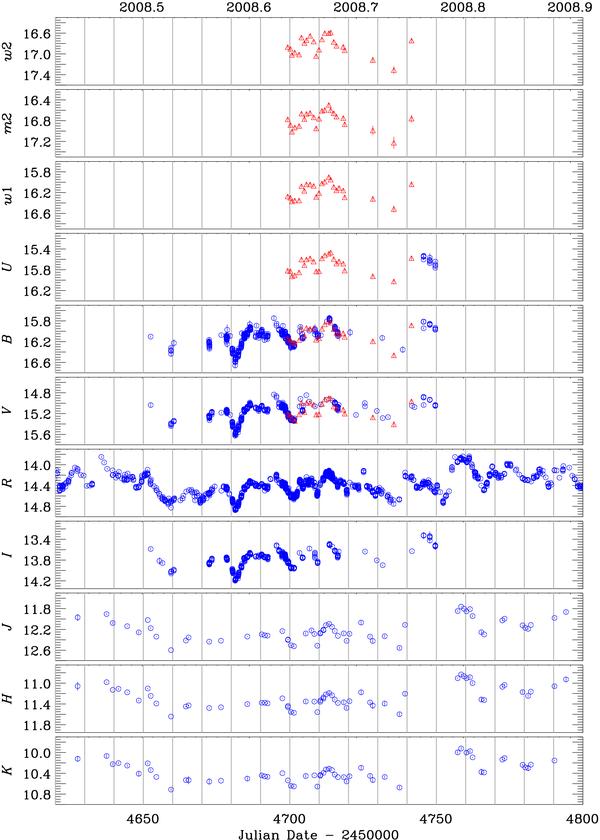
June–November 2008 light curves of BL Lacertae from UV to near-IR after correction for the host galaxy contribution, but not for the Galactic extinction. Data taken by the GASP-WEBT collaboration are plotted as blue circles, UVOT data as red triangles. The UVOT u, b, and v light curves have been shifted to match the ground-based U, B, and V ones (see text for details).
Current usage metrics show cumulative count of Article Views (full-text article views including HTML views, PDF and ePub downloads, according to the available data) and Abstracts Views on Vision4Press platform.
Data correspond to usage on the plateform after 2015. The current usage metrics is available 48-96 hours after online publication and is updated daily on week days.
Initial download of the metrics may take a while.