Free Access
Fig. 1
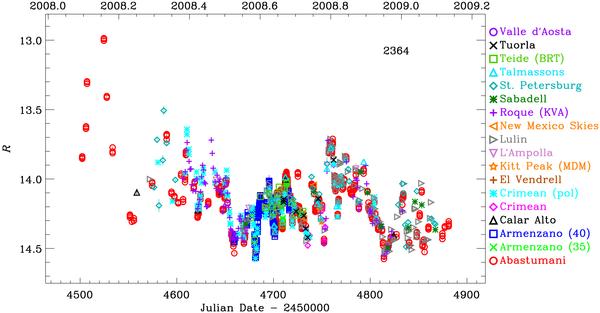
R-band light curve by the GASP collaboration from February 2008 to February 2009. Data are not corrected for the host galaxy contamination or Galactic extinction. The participating observatories are marked with different symbols and colours. The total number of data points is indicated in the upper right.
Current usage metrics show cumulative count of Article Views (full-text article views including HTML views, PDF and ePub downloads, according to the available data) and Abstracts Views on Vision4Press platform.
Data correspond to usage on the plateform after 2015. The current usage metrics is available 48-96 hours after online publication and is updated daily on week days.
Initial download of the metrics may take a while.