Free Access
Fig. 8
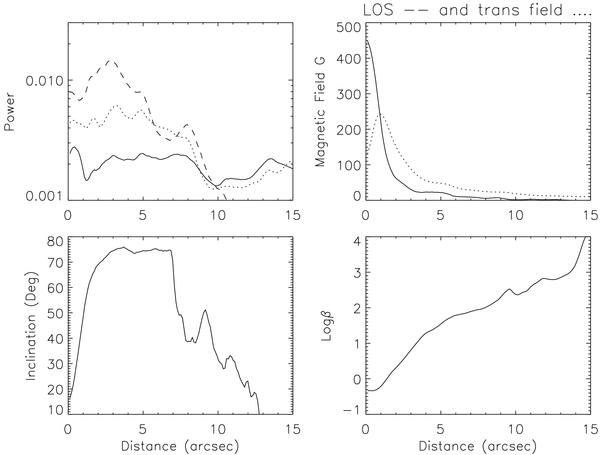
From upper left to lower right: azimuthally averaged power at 3, 5 and 7 min period bands (solid, dotted and dashed lines, respectively), of the DS at Hα ± 0.7 Å, LOS and transverse field, field inclination angle with respect to the vertical and logarithm of the plasma β. The profiles are calculated at 0.485 Mm.
Current usage metrics show cumulative count of Article Views (full-text article views including HTML views, PDF and ePub downloads, according to the available data) and Abstracts Views on Vision4Press platform.
Data correspond to usage on the plateform after 2015. The current usage metrics is available 48-96 hours after online publication and is updated daily on week days.
Initial download of the metrics may take a while.