Fig. 4
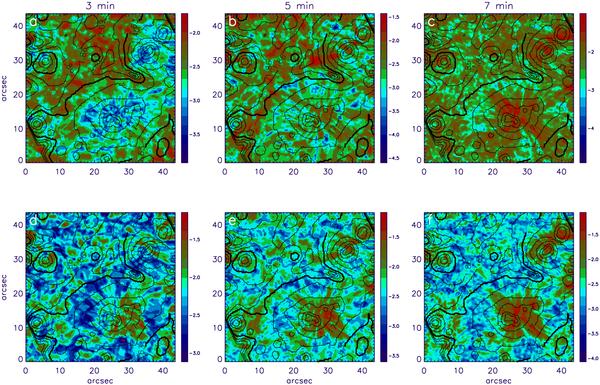
Power maps (each panel in logarithmic scale) at the 3, 5 and 7 min period bands of the DS at 0.35 Å (top row) and 0.70 Å (bottom row) from the Hα line center (power in arbitrary units). Overlayed are the contours of the βTH with the bold contour defining the height of 1.6 Mm. The space between consecutive contours, in βTH, is 0.32 Mm (see text). In color in the on-line edition of the paper.
Current usage metrics show cumulative count of Article Views (full-text article views including HTML views, PDF and ePub downloads, according to the available data) and Abstracts Views on Vision4Press platform.
Data correspond to usage on the plateform after 2015. The current usage metrics is available 48-96 hours after online publication and is updated daily on week days.
Initial download of the metrics may take a while.