Fig. 3
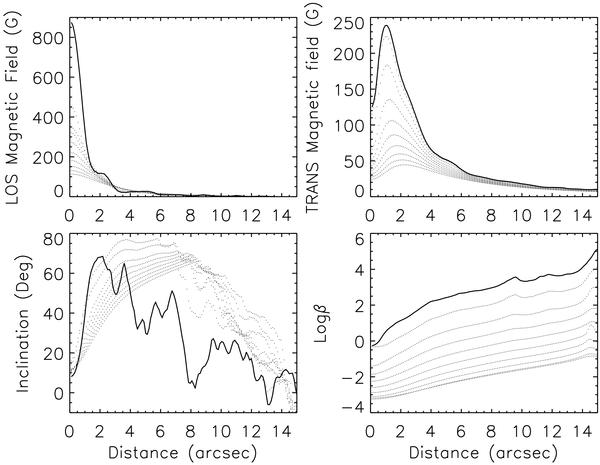
Azimuthal averages of the LOS and transverse field components (first row, left and right panels, respectively), the field inclination in respect to the vertical and the logarithm of plasma β (second row, left and right panels, respectively). In all panels, the solid line corresponds to the base of the extrapolated field, at ~250 km. The dotted lines correspond to extrapolation heights increasing progressively by 235 km from the highest to the lowest curve. In all cases, 0″ corresponds to the center of the rosette (see Fig. 1).
Current usage metrics show cumulative count of Article Views (full-text article views including HTML views, PDF and ePub downloads, according to the available data) and Abstracts Views on Vision4Press platform.
Data correspond to usage on the plateform after 2015. The current usage metrics is available 48-96 hours after online publication and is updated daily on week days.
Initial download of the metrics may take a while.