Fig. 9
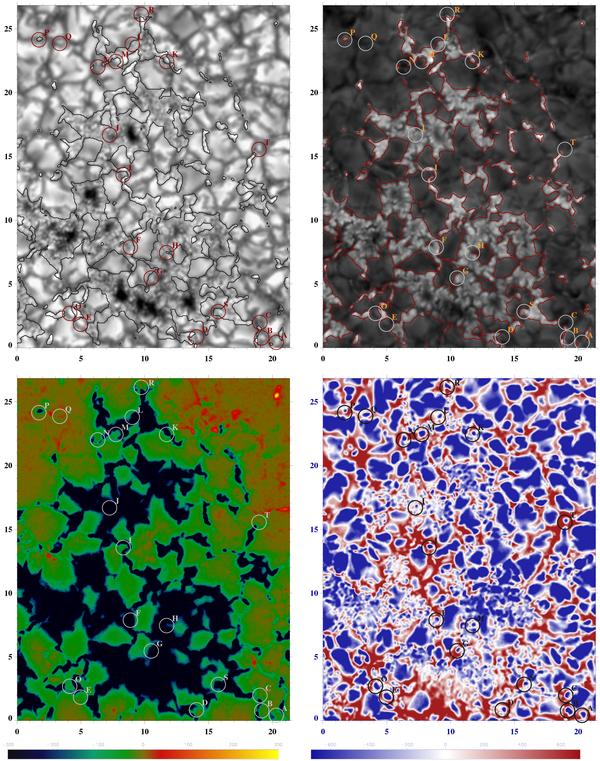
The ROI shown in Fig. 1, used to identify various upflow features (marked A–T). The upper row shows the continuum image and the Imin map, the lower row BLOS and vLOS maps obtained from inversions. The black/red contours correspond to |BLOS| = 200 G. Tick marks are in units of arcsec. The color bars indicates the signed LOS magnetic field in Gauss (left) and LOS velocity in m s-1(right). Except for the color and grey scales used, this figure is identical to Fig. 6.


Current usage metrics show cumulative count of Article Views (full-text article views including HTML views, PDF and ePub downloads, according to the available data) and Abstracts Views on Vision4Press platform.
Data correspond to usage on the plateform after 2015. The current usage metrics is available 48-96 hours after online publication and is updated daily on week days.
Initial download of the metrics may take a while.