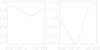
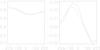
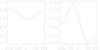
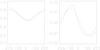
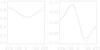
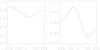
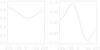
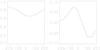
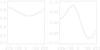
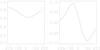
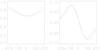
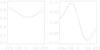
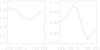
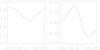
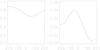
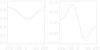
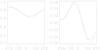
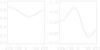
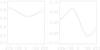
Fig. 7
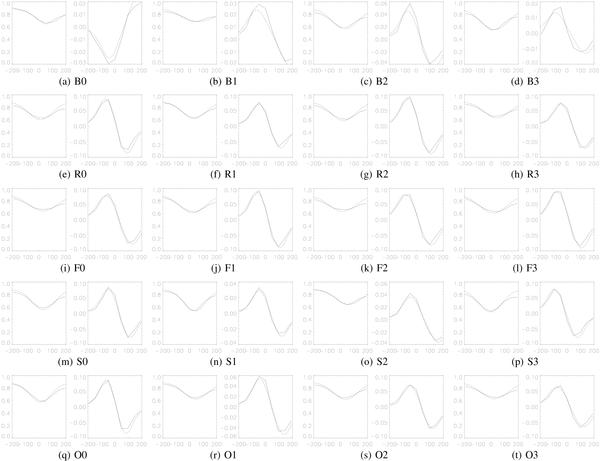
Observed (solid) and fitted (dashed) Stokes I and V profiles for isolated bright points (B0–B3), ribbons (R0–R3), flowers (F0–F3), strings (S0–S3), and other features (O0–O3) indicated in Fig. 6. Both Stokes I and V are normalized to the continuum intensity, the wavelength of which is outside the range plotted. Wavelengths along the x-axis are in units of mÅ.

Current usage metrics show cumulative count of Article Views (full-text article views including HTML views, PDF and ePub downloads, according to the available data) and Abstracts Views on Vision4Press platform.
Data correspond to usage on the plateform after 2015. The current usage metrics is available 48-96 hours after online publication and is updated daily on week days.
Initial download of the metrics may take a while.