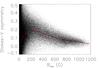
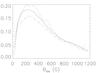
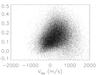
Fig. 5
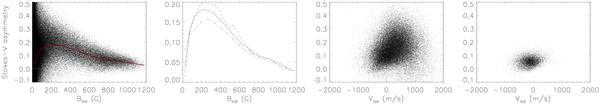
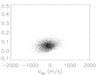
Statistical properties of Stokes V amplitude asymmetry, δa. From left to right, the correlation of δa with the strength of the LOS magnetic field, |BLOS| , for all data (first plot) and the averaged δa for dark (upper curve), all (middle curve) and bright (lower curve) structures (second plot). The third plot shows the correlation between LOS velocity and δa for 200 G < |BLOS| < 800 G, the fourth plot for |BLOS| > 800 G.
Current usage metrics show cumulative count of Article Views (full-text article views including HTML views, PDF and ePub downloads, according to the available data) and Abstracts Views on Vision4Press platform.
Data correspond to usage on the plateform after 2015. The current usage metrics is available 48-96 hours after online publication and is updated daily on week days.
Initial download of the metrics may take a while.