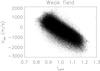
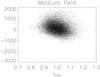
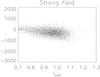
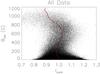
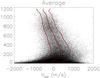
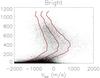
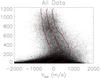
Fig. 2
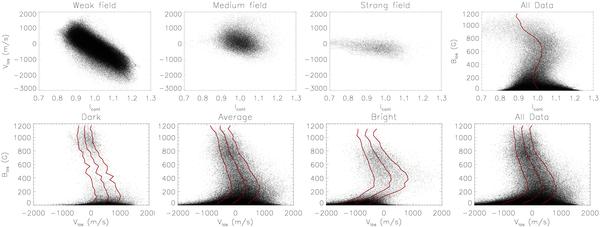
The top row shows correlations between continuum intensity and LOS velocity for weak (|BLOS| < 50 G), medium strong (200 G < |BLOS| < 800 G), and strong (800 G < |BLOS| ) magnetic field and the correlation between the continuum intensity and LOS magnetic field. The bottom row shows correlations between LOS velocity and LOS magnetic field for dark (Ic/ ⟨ Ic ⟩ < 0.9), average (0.9 < Ic/ ⟨ Ic ⟩ < 1.05), and bright (1.05 < Ic/ ⟨ Ic ⟩ ) structures. Red lines show binned averages and in the lower row also ± 1 standard deviations of the variations.

Current usage metrics show cumulative count of Article Views (full-text article views including HTML views, PDF and ePub downloads, according to the available data) and Abstracts Views on Vision4Press platform.
Data correspond to usage on the plateform after 2015. The current usage metrics is available 48-96 hours after online publication and is updated daily on week days.
Initial download of the metrics may take a while.