| Issue |
A&A
Volume 524, December 2010
|
|
|---|---|---|
| Article Number | A53 | |
| Number of page(s) | 8 | |
| Section | Cosmology (including clusters of galaxies) | |
| DOI | https://doi.org/10.1051/0004-6361/201014933 | |
| Published online | 23 November 2010 | |
The distinguishing factor for gravity models: stellar population synthesis
Institute for Advanced Studies in Basic Sciences (IASBS),
PO Box 45195-1159
Zanjan,
Iran
e-mail: This email address is being protected from spambots. You need JavaScript enabled to view it.
Received: 4 May 2010
Accepted: 2 September 2010
Abstract
Alternative gravitations of Milgrom (MOND), Moffat (MOG), and CDM scenarios all simulate rotation curves of spirals with reasonable details. They display significant disparities however in predicting the stellar mass-to-light (M∗/L) ratios of the galaxies. We maintain this feature could serve as a distinguishing factor between different alternative theories. We analyze the rotation curves of 46 low- and high-surface brightness galaxies and compare the resulting M∗/Ls with the predictions of the Stellar Population Synthesis (SPS) scheme. The color–M∗/L correlation obtained for MOND is consistent with predictions of SPS models. MOG does not show this consistency, and the M∗/Ls of CDM model shows large dispersions. Furthermore, M∗/L ratios of MOND with Bekenstein interpolating function favor Kroupa’s initial mass function (IMF) of the SPS scheme, while those of MOND with standard and simple interpolating functions are consistent with Salpeter’s IMF. Here is another indication to differentiate between different IMFs that are used in SPS context.
Key words: galaxies: spiral / gravitation / galaxies: kinematics and dynamics / dark matter
© ESO, 2010
1. Introduction
The gravitational force of the observable mass of large astronomical systems, galaxies, clusters of galaxies, or for that matter, the universe in general, is not sufficiently strong to explain the observed dynamics of the systems. To resolve the dilemma, one main school of investigators has resorted to dark matter/dark energy scenarios. In spite of extensive efforts, however, no one has so far reported a direct identification of the hypothesized dark entity through non-gravitational interactions with the observable matter. This lack of direct identification has inspired an equally intensive effort to contemplate alternative theories of gravitation. The Modified Newtonian Dynamics (MOND) of Milgrom (1983) and of Bekenstein (2004), the Modified Gravity (MOG) of Moffat (2005), the Nonlocal Nonlinear gravity of Sobouti (2008a,b, 2009), and varieties of f(R) gravities (Capozziello 2002; 1; Carroll et al. 2004; Sobouti 2007; Sobouti et al. 2009) fall in this category.
Rotation curves of spiral galaxies as measured by the 21 cm line of HI often extend well beyond the optical disks of the galaxies and provide a valuable body of data to determine the radial dependency of the gravitational forces in galactic scales. In this paper we construct rotation curves of a large sample of galaxies from the distribution of their detectable matter through three different gravity models, MOND, MOG, and Newtonian gravity plus cold dark matter (CDM) halos. At first glance all three models seem to reproduce the observed data with reasonable detail. On a deeper examination, however, we find significant disparities in their predictions of stellar mass-to-light, M∗/L, ratios. To differentiate between the models we resort to stellar population synthesis, SPS, analysis and the color–M∗/L correlation predicted therein through various initial mass functions (IMF). There is the possibility to use this feature to discriminate between different gravity models and different IMFs.
The paper is organized as follows: in Sect. 2 we give a brief review of the different gravity models used in our analysis. In Sect. 3 we describe our galaxy sample. Fits to the observed rotation curves are discussed in Sect. 4. Numerical results and brief concluding remarks are given in Sects. 5 and 6.
2. Alternative gravity models
In this section we review the basic tenets of two alternative gravities as well as the Newtonian gravity plus CDM halos. We present the end formulas that we will use in the study of the dynamics of galaxies. All three accommodate the two main asymptotic features of the rotation curves of spirals: the slow non-Keplerian decline of the curves at large distances from the galaxy, and the Tully-Fisher (TF) relation, which is the approximate proportionality of the asymptotic speed of an orbiting object to the fourth root of the mass of the galaxy (Tully & Fisher 1977).
Actually there is much debate on how fast or slow the rotation curves decline, if at all (Persic et al. 1996; Salucci et al. 2007; Gentile 2008). There are also refinements and redefinitions to the Tully-Fisher relation. McGaugh (McGaugh 2005) prefers to use the total baryonic (stellar + gaseous) mass in TF relation to accommodate the gas-rich galaxies. See also Stark et al. (2009), for a calibration of the baryonic TF relation with the help of gas dominated galaxies. Nonetheless, both assumptions are adequate approximations to the observed data and will be employed in this paper.
2.1. Modified Newtonian dynamics of Milgrom, MOND
Based on observations of galactic rotation curves, Milgrom (1983) argues that the Newtonian dynamics is not viable below a certain universal acceleration, a0 ≃ 1.2 × 10⁻¹⁰ m/s2. To comply with the Tully-Fisher relation he modifies the law of motion to have an asymptotic acceleration proportional to the square root of the Newtonian acceleration. The MOND acceleration, gmond, and the Newtonian one, gN, are connected through Eq. (1) below  (1)where μ(x) is an interpolating function for transition from the Newtonian to the MONDian regime. It runs smoothly from μ(x) = x for x ≪ 1 to μ(x) = 1 for x ≫ 1. Here we adopt three functions commonly used, the standard interpolating function of Bekenstein & Milgrom (2004):
  (2)the simpler function of Famaey & Binney (2005),
  (3)and Bekenstein’s interpolating function (2004)
  (4)Hereafter, the analysis using μ1, μ2 and μ3 will be refereed to as MOND1, MOND2 and MOND3, respectively.
2.2. Modified Gravity of Moffat, MOG
Modified Gravity of Moffat consists of three theories of gravity: the nonsymmetric gravity theory (NGT), the metric-skew-tensor gravity (MSTG) theory, and the scalar-tensor-vector gravity (STVG). They rely on the existence of a massive vector field universally coupled to matter. Moffat maintains that MOG explains the rotation curves of galaxies, clusters of galaxies, and cosmological issues without resorting to dark matter (Moffat 1995, 2005, 2006; Moffat & Toth 2009). Good fits to astrophysical and cosmological data have been obtained with his recent version of STVG. One notable feature of NGT, MSTG, and STVG is that the modified acceleration at weak gravitational fields has a Yukawa-type addition to the Newtonian acceleration. In the weak field limit, STVG, NGT, and MSTG produce similar results. The recipe for the gravitational force of a spherically distributed mass, M(r), is (Moffat 2006) ![Mathematical equation: \begin{eqnarray} \label{gmog} g_{\rm mog}&=&\frac{G(r)M(r)}{r^2},\\ G(r)&=& G_{\rm N} \times\left\{1+\alpha(r)\left[1-{\rm e}^{-r/r_0}\left(1+\frac{r}{r_0}\right)\right]\right\}, \nonumber \end{eqnarray}](/articles/aa/full_html/2010/16/aa14933-10/aa14933-10-eq19.png) (5)where GN is the Newtonian gravitational constant, M(r) is the baryonic mass inside the radius r, and α(r) = [ M0/M(r) ] 1/2. The parameters M0 or r0 determine the coupling strength of the vector field to the baryonic matter and to the range of the force, respectively. They are not universal constants and vary with the size of the systems (Brownstein & Moffat 2006; Haghi & Rahvar 2010). In galactic scales, they are determined by analyzing the best fit of the theory to the rotation curves of LSB and HSB galaxies. For normal size galaxies, they are reported as M0 = 9.6 × 10¹¹ M⊙ and r0 = 13.9 kpc, and for dwarf galaxies, as M0 = 2.4 × 10¹¹ M⊙ and r0 = 9.7 kpc (Moffat 2006). An empirical fitting of M0 versus r0 for a wide range of spherically symmetric systems, from solar size to clusters of galaxies is depicted in Fig. 1 of Brownstein & Moffat (2006). The MOG gravitation tends to the Newtonian one as M0 → 0 and r0 → ∞.
(5)where GN is the Newtonian gravitational constant, M(r) is the baryonic mass inside the radius r, and α(r) = [ M0/M(r) ] 1/2. The parameters M0 or r0 determine the coupling strength of the vector field to the baryonic matter and to the range of the force, respectively. They are not universal constants and vary with the size of the systems (Brownstein & Moffat 2006; Haghi & Rahvar 2010). In galactic scales, they are determined by analyzing the best fit of the theory to the rotation curves of LSB and HSB galaxies. For normal size galaxies, they are reported as M0 = 9.6 × 10¹¹ M⊙ and r0 = 13.9 kpc, and for dwarf galaxies, as M0 = 2.4 × 10¹¹ M⊙ and r0 = 9.7 kpc (Moffat 2006). An empirical fitting of M0 versus r0 for a wide range of spherically symmetric systems, from solar size to clusters of galaxies is depicted in Fig. 1 of Brownstein & Moffat (2006). The MOG gravitation tends to the Newtonian one as M0 → 0 and r0 → ∞.
Best-fit reduced χ2 and M∗/L values of 32 HSB and 14 LSB galaxies in MOND with different interpolating functions, MOG, and NFW models.
2.3. Newtonian gravity plus cold dark matter, CDM
In this scenario, gravitation is Newtonian. To account for the nonclassical behavior of the rotation curves one adds a spherically symmetric dark halo to the galaxy. Here, we consider a NFW halo with the density distribution 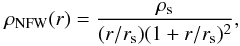 and the gravitational acceleration
 ![Mathematical equation: \begin{equation} g_{\rm NFW}=4\pi G \rho_{\rm s} r_{\rm s} \left (\frac{r_{\rm s}}{r} \right )^2\left[\ln\left(1+\frac{r}{r_{\rm s}}\right)-\frac{r/r_{\rm s}}{(1+r/r_{\rm s})}\right],\label{cdm} \end{equation}](/articles/aa/full_html/2010/16/aa14933-10/aa14933-10-eq38.png) (6)where rs and ρs are the characteristic radius and density of the distribution (Navarro et al. 1996). The NFW density comes from numerical simulations of ΛCDM theory in the framework of structure formation. There, one also finds that these parameters are correlated to each other as in Eqs. (7) and (8) below, leaving only one free parameter to characterize the halo (see Bullock et al. 2001; Wechsler et al. 2002, and Neto et al. 2007, for details). Thus,
(6)where rs and ρs are the characteristic radius and density of the distribution (Navarro et al. 1996). The NFW density comes from numerical simulations of ΛCDM theory in the framework of structure formation. There, one also finds that these parameters are correlated to each other as in Eqs. (7) and (8) below, leaving only one free parameter to characterize the halo (see Bullock et al. 2001; Wechsler et al. 2002, and Neto et al. 2007, for details). Thus, 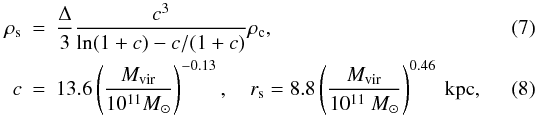 where ρc is the critical density of the Universe and Δ = 200 is the virial overdensity at redshift z = 0 (Bryan & Norman 1998).
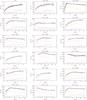 |
Fig. 1 Rotation curves of 32 mainly HSB galaxies. The points with vertical error bars are the observed data. The dotted (black) and short dashed lines are contributions of the gaseous and stellar components to the Newtonian rotation speeds, respectively. The long dashed (blue) line is that of MOND1. The solid line is the rotation curve constructed through MOND3. The M∗/Ls of MOND3 are used in plotting the stellar component. The dashed-dotted (green) and dotted (red) lines are those of the MOG and NFW models, respectively. |
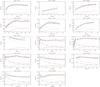 |
Fig. 1 continued. The last seven galaxies have a bulge component, depicted as dashed-dotted lines. |
3. Observational data
There are diverse morphological types of galaxies with diverse shapes and sizes to their rotation curves. Our sample, a collection of 46 galaxies taken from Sanders (1996), McGaugh & de Blok (1998b), Sanders & Verheijen (1998), and Begeman (1991), accommodates these diversities. Members of the sample have well measured rotational speeds and accurate surface photometry. They are listed in Table 1 and shown in Figs. 1–2.
The sample includes several very large and luminous members with well-extended rotation curves, e.g., UGC 2885, NGC 801, and NGC 2903. They have high surface brightness (HSB), massive stellar component, and low gas content. Typically, their rotation curve rises steeply to a maximum and declines slowly into an almost horizontal asymptote. There are also a number of dwarf, gas-dominated, and low-surface brightness (LSB) galaxies, e.g. DDO 168. There is no conspicuous maximum, and in some galaxies not even a flat asymptote to their rotation curve. It is generally believed that deviations from the classical dynamics is more pronounced in LSBs than in HSBs (McGaugh & de Blok 1998a; Sanders & Noordermeer 2007; Gentile et al. 2010).
Twenty-eight members of the sample, of both HSB and LSB types, are located in the Ursa Major cluster of galaxies, believed to be at the distance of about 15.5 Mpc (Tully & Verheijen 1997). Seven of the galaxies, listed in Table 2, have central bulges and are treated differently, the reason is explained below. For a full description of the sample the interested reader is referred to Sanders & McGaugh (2002).
4. Constructing rotation curves
We calculate the rotation speed of a test object circling the galaxy as a function of distance from the galactic center and the distribution of the detectable matter in the galaxy. The procedure we follow is almost that of Sanders & McGaugh (2002):
-
In order to calculate the MOND rotation curves, the first step isdetermining the Newtonian acceleration of the detectablematter, gN via the classical Poisson equation. Given the Newtonian acceleration, the effective acceleration is calculated from the MOND Eq. (1). For MOG, we approximate the galaxy by a spherically symmetric system. The error committed in this approximation, as described in Binney & Tremaine (1987), is on the order of 15%.
-
We assume a constant M∗/L ratio throughout the galaxy, though this is not strictly the case, because of the color gradient in spiral galaxies. However, in seven bulged spirals we find assigning different M∗/L to the bulge and the disk improves the fit to the observed data.
-
We assume the HI gas is in co-planer rotation about the center of the galaxy, an assumption which may not hold in galaxies with strong bars (Sanders & McGaugh 2002).
Given the observed distribution of the baryonic matter (stellar and gaseous disks, plus a spheroidal bulge, if present), the effective radial gravitational force, and subsequently the circular speed, is calculated from Eqs. (1) and (5), (6). Fitting of the calculated rotation curves to the observed data points is achieved by adjusting the M∗/L ratio, through a least-square χ2, defined as  (9)where σi is the observational uncertainty in the rotation speeds. The M∗/L ratio of the disk and of the bulge are our ultimate results.
5. Numerical results
All models trace the observed data with reasonable detail. The best-fit χ2 and M∗/L values are listed in Table 1. Figures 1, 2 show fits of theoretically constructed rotation curves to the observations of 46 galaxies. The general trend of HSB curves (steep rise to a maximum followed by gradual decline to an almost flat asymptote), and of LSB curves (slow rise often with no asymptote in sight) are evident.
Seven galaxies have prominent bulge components. One expects a bulge with an older population of stars to have a higher M∗/L ratio than a disk with a younger population. Therefore, to obtain a better fit for these galaxies, we have allowed the model to choose different M∗/Ls for the disk and the bulge. The result, shown in Table 2, confirms the expectation. The minimum χ2s of Table 2 are detectably lower than those of the corresponding entries of Table 1 obtained by a single M∗/L fit. Nevertheless, one galaxy in MOND3, NGC 801, and four in MOND1, NGC 801, NGC 5371, UGC 2885, and NGC 5907, predict untenably lower M∗/L for the bulge than for the disk.
McGaugh (private communication) advises us that this oddity might partially be owing to the low resolution of HI data and/or the sharp rise of v(r) in the bulge. If v(r) is not quite resolved, one tends to underestimate it, and the M∗/L of the bulge with it. In many of these galaxies it is indeed not obvious if the inner component is really a “bulge" in the classical sense of a 3D component with an r1/4 profile. It is also said that neglecting the flattening of a bulge leads to an error in its mass-to-light ratio (Noordermeer 2008). In NGC 6946, there is a tiny bulge (4% of the total light in B-band). It shows up as a small kinematic bump in the inner 1 kpc in high-resolution Fabry-Pérot data (Blais-Ouellette et al. 2004). Moreover, the HI distribution in NGC 6946 is not symmetric in the galactic plane. It is patchy and seems to deviate from circular orbits (Carginan et al. 1990).
Same as Table 1 for seven bulged galaxies.
Linear, M∗/L = (M∗/L)0 + mr, fit for 3 cases not well explained by either MOND3 formalism or by that of MOND1.
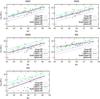 |
Fig. 3 Plots of M∗/L versus B − V. The solid line in each panel is the best fit to the prediction of the model in question. The slopes and y-intercepts of best-fitted lines are shown in the panels. Slopes of MOND1, MOND2, and MOND3 are reasonably close to the prediction of SPS, 1.74. That of MOG is not. Data points in NFW panel are much dispersed to conclude a meaningful correlation. In MOND1, MOND2, and MOND3 errors in the slopes, ±(0.23,0.21,0.26), respectively, are small enough to distinguish one model from the other. The errors in the y-intercepts, ±(0.12,0.14,0.15), respectively, are small enough to distinguish one IMF from the other. The other lines are the theoretical predictions of SPS with different IMFs (Bell & de Jong 2001, Bell et al. 2003). They are included here for comparison. They have almost the same slope, but different y-intercepts. |
Ten entries in Table 1 have unacceptably large χ2s. Suspecting the failure of the assumption of constant M∗/L, we have followed Barnes et al. (2007), and examined a radially varying, M∗/L = (M∗/L)0 + mr. The best-fit values of the constants (M∗/L)0 and m for some of them are displayed in Table 3. The slope, m, is much too small to result in appreciably lower χ2. The reason for the failure should lie elsewhere. For example, the assumption of cold unobservable molecular gas in the galactic disk (Tiret & Combes 2009) leads to better fits with lower χ2.
6. Color–M∗/L correlation
How realistic are the inferred M∗/L ratios? Stellar population synthesis (SPS) models predict a linear relation between colors and M∗/L ratios. Redder galaxies should have higher M∗/L ( see, e.g., Bell & de Jong 2001; Bell et al. 2003; Portinari et al. 2004). The slope of this linear relation does not depend on the exact details of the history of star formation, i.e. the assumed IMF. But depending on how many stars are present at the low-mass end of the stellar IMF, the color-M∗/L curve shifts up and down. This is because low-mass stars contribute significantly to the mass of a population, but not as much to its luminosity and color (Bell & de Jong 2001).
In the SPS scheme Salpeter’s (1955) IMF overestimates the M∗/L ratios of many of the galaxies and violates the condition of “less disk mass than the mass of maximum disk”. To remedy this, Bell et al. (2003) scale down Salpeter’s IMF and come up with a limit for the color-M∗/L relation above which the physical viability is not guaranteed. Their suggested relation is  (10)There are other IMF that lead to slightly different relations. For example, based on an analysis of the vertical velocity dispersion of stars, Bottema (1997) argues for a substantially submaximal M/L ratio for all disk-dominated galaxies. Alternatively Kroupa (2001) introduces a turnover at the low-mass end of his IMF.
In Eq. (10) the slope 1.74 is not sensitive to variations in IMF, but the y-intercept is. To obtain the equivalent relation for standard Salpeter’s, Kroupa’s, and Bottema’s IMF one should shift Eq. (10) and the plots in Fig. 3 up and down by about (0.15, −0.15, −0.35) dex, respectively (Bell et al. 2003).
In Fig. 3 we contrast M∗/L ratios of the three gravity models against the predictions of SPS, where we use the B-band luminosities of Sanders & McGaugh (2002). In each frame the solid line is the best fit to the data points obtained from the analysis of the rotation curves. The theoretical SPS predictions of Bell & de Jong (2001), and Bell et al. (2003) for different IMFs are also plotted. The slope of MOND1, 1.78 ± 0.23, of MOND2, 1.81 ± 0.21, and of MOND3, 1.75 ± 0.26 are reasonably close to that of Eq. (10). The corresponding y-intercepts, −0.88 ± 0.14, −1.06 ± 0.12, and −1.13 ± 0.15, respectively, are also in harmony with that of Eq. (10). The uncertainties in slopes and y-intercepts are in the 1-σ error range. The errors in y-intercepts are small enough to enable one to distinguish between different IMFs. MOND1 falls somewhere between standard Salpeter’s and scaled Salpeter’s IMF. MOND2 agrees with Kroupa’s and scaled Salpeter’s IMF. MOND3 is in good agreement with Kroupa’s IMF.
The slope for MOG, 1.06 ± 0.21, cannot be reconciled with SPS predictions. The case of NFW is also questionable. Although the slope, 2.33 ± 0.67, is consistent with 1.74, considering its large error bar, the dispersion of the simulated data points is too large to conclude a meaningful color–M∗/L correlation.
Any alternative gravity can have a dark matter equivalent. Deviations from the Newtonian gravity can be attributed to a hypothetical dark entity and a dark density profile calculated through Poisson’s equation, for instance. One feature however distinguishes this interpretation from the conventional CDM scenarios. Here, there is a well defined relation between the baryonic matter and its so-interpreted dark companion. While in CDM models, baryonic and dark matters may co-exist independently. In our opinion, the reason for the good agreement of MOND with SPS predictions and non-compliance of CDM with it lies in the existence or non-existence of this relation between the observable and non-observable matters. In MOND, baryonic matter plays a pivotal role, and the dark entity owes its existence to it. This is not the case in CDM. Dark matter is allowed to play a role independently ofthe observable matter. As for MOG, we are not in a position to express an opinion.
Let us summarize our conclusion: a) the SPS scheme can distinguish between different gravity models and b) the two together can choose between different IMFs. The mere fact that a gravity theory reproduces the observed rotation curves satisfactorily does not tell the whole story.
7. Concluding remarks
At least on galactic scales, dynamics of spirals cast doubt on the viability of the classical theories of gravitation. A number of alternative theories are capable of reproducing the rotation curves of spirals with acceptable detail, a nontrivial fact that deserves attention. In this paper we used two alternative theories of gravitation, MOND and MOG, and a CDM model to deduce the dynamics of a well-sized sample of high- and low-surface brightness galaxy types, and checked the results against observations. The models are not equivalent although they all simulate the rotation curves in more or less to the same degree of accuracy.
In MOND and MOG, rotation curves are constructed with only one free adjustable parameter, the stellar mass-to-light ratio. This is in contrast to the CDM model, where an additional parameter is needed to describe the dark component.
There are cases of bulged galaxies where fits to observations lead to lower M∗/L ratios for the bulge than for the disk. This might be owing to the low resolution of the HI data and to the inner v(r), and/or uncertain size of the bulge.
Stellar population synthesis models impose constraints on M∗/L. Redder galaxies should have higher M∗/L ratios. MOND with different interpolating functions meets this expectation, albeit with different IMFs. This is remarkable, because there is no explicit/implicit connection between the basic tenets of the SPS and MOND. On the other hand, MOG does not meet the SPS constraints, and the data points of CDM show a large scatter, preventing one to conclude a meaningful color–M∗/L correlation.
The SPS predictions of M∗/L ratios are sensitive to the adopted IMF. The M∗/L ratios inferred from Salpeter’s IMF are notably higher than those obtained from Kroupa’s. MOND3 favors Kroupa’s IMF. It produces lower M∗/L and implies lesser disk masses.
Acknowledgments
Stacy McGaugh provided us with his recent data on rotation curves. We thank him and also Eric Bell, Roelf de Jong, Mohammad Dehghan Niry, and Pavel Kroupa for their useful comments. We sincerely thank Prof. Dr. Yousef Sobouti, the director of IASBS, for useful comments and important contribution in writing this article.
References
- Barnes, E. I., Kosowsky, A., & Sellwood, J. A. 2007, AJ, 133, 1698 [NASA ADS] [CrossRef] [Google Scholar]
- Begeman, K. G., Broeils, A. H., & Sanders, R. H. 1991, MNRAS, 249, 523 [NASA ADS] [CrossRef] [Google Scholar]
- Bekenstein, J. D. 2004, Phys. Rev. D, 70, 083509 [NASA ADS] [CrossRef] [Google Scholar]
- Bekenstein, J. D., & Milgrom, M. 1984, ApJ, 286, 7 [NASA ADS] [CrossRef] [Google Scholar]
- Bell E. F., & de Jong R. S. 2001, ApJ, 550, 212 [NASA ADS] [CrossRef] [Google Scholar]
- Bell, E. F., McIntosh, D. H., Katz, N., & Weinberg, M. D. 2003, ApJS, 149, 289 [NASA ADS] [CrossRef] [Google Scholar]
- Binney J., & Tremaine, S. 1987, Galactic Dynamics (Princeton, NJ: Princeton Univ. Press) [Google Scholar]
- Blais-Ouellette, S., Amram, P., Carignan, C., & Swaters, R. 2004, A&A, 420, 147 [NASA ADS] [CrossRef] [EDP Sciences] [Google Scholar]
- Bottema, R. 1997, A&A, 328, 517 [NASA ADS] [Google Scholar]
- Bryan, G. L., & Norman, M. L. 1998, ApJ, 495, 80 [NASA ADS] [CrossRef] [Google Scholar]
- Brownstein, J. R., & Moffat, J. W. 2006, ApJ, 636, 721 [Google Scholar]
- Bullock, J. S., Kolatt, T. S., Rachel, Y. S., et al. 2001, MNRAS, 321, 559 [Google Scholar]
- Capozziello, S. 2002, Int. J. Mod. Phys. D., 11, 483 [NASA ADS] [CrossRef] [MathSciNet] [Google Scholar]
- Capozziello, S., Cardone, V. F., & Troisi, A. 2006, JCAP, 8, 1 [NASA ADS] [CrossRef] [Google Scholar]
- Capozziello, S., Cardone, V. F., & Troisi, A. 2007, JCAP, 375, 1423 [Google Scholar]
- Carignan, C., Charbonneau, P., Boulanger, F., & Viallefond, F. 1990, A&A, 234, 43 [NASA ADS] [Google Scholar]
- Carroll, S., Duvvuri, V., Trodden, M., & Turner, M. 2004, Phys. Rev. D, 70, 2839 [Google Scholar]
- Famaey, B., & Binney, J. 2005, MNRAS, 363, 603 [NASA ADS] [CrossRef] [Google Scholar]
- Gentile, G. 2008, ApJ, 684, 1018 [NASA ADS] [CrossRef] [Google Scholar]
- Gentile, G., Baes, M., Famaey, B., & Van Acoleyen, K. 2010, MNRAS, 406, 2493 [NASA ADS] [CrossRef] [Google Scholar]
- Haghi, H., & Rahvar, S. 2010, IJTP, 49, 1004 [NASA ADS] [Google Scholar]
- Kroupa, P. 2001 MNRAS, 322, 231 [NASA ADS] [CrossRef] [Google Scholar]
- McGaugh, S. S. 2005, ApJ, 632, 859 [NASA ADS] [CrossRef] [Google Scholar]
- McGaugh, S. S., & de Blok, W. J. G. 1998a, ApJ, 499, 41 [NASA ADS] [CrossRef] [Google Scholar]
- McGaugh, S. S., & de Blok, W. J. G. 1998b, ApJ, 499, 66 [NASA ADS] [CrossRef] [Google Scholar]
- Milgrom, M. 1983, ApJ, 270, 365 [NASA ADS] [CrossRef] [Google Scholar]
- Moffat, J. W. 1995, Phys. Lett. B, 355, 447 [NASA ADS] [CrossRef] [Google Scholar]
- Moffat, J. W. 2005, JCAP, 2005, 003 [NASA ADS] [Google Scholar]
- Moffat, J. W. 2006, JCAP, 2006, 004 [Google Scholar]
- Moffat, J. W., & Toth, V. T. 2009, ApJ, 680, 1158 [Google Scholar]
- Navarro, J. F., Frenk, C. S., & White, S. D. M. 1996, ApJ, 462, 563 [NASA ADS] [CrossRef] [Google Scholar]
- Neto, A. F., Gao, L., Bett, P., et al. 2007, MNRAS, 381, 1450 [NASA ADS] [CrossRef] [Google Scholar]
- Noordermeer, E. 2008, MNRAS, 385, 1359 [NASA ADS] [CrossRef] [Google Scholar]
- Persic, M., Salucci, P., & Stel, F. 1996, MNRAS, 281, 27 [NASA ADS] [CrossRef] [Google Scholar]
- Portinari, L., Sommer-Larsen, J., & Tantalo, R. 2004, MNRAS, 347, 691 [NASA ADS] [CrossRef] [Google Scholar]
- Salpeter, E. E. 1955, ApJ, 121, 161 [Google Scholar]
- Salucci, P., Lapi, A., Tonini, C., et al. 2007, MNRAS, 378, 41 [NASA ADS] [CrossRef] [Google Scholar]
- Sanders, R. H. 1996, ApJ, 473, 117 [NASA ADS] [CrossRef] [Google Scholar]
- Sanders, R. H., & Verheijen M. A. W., 1998, ApJ, 503, 97 [NASA ADS] [CrossRef] [Google Scholar]
- Sanders, R. H., & McGaugh S. S. 2002, ARA&A, 40, 263 [NASA ADS] [CrossRef] [Google Scholar]
- Sanders, R. H., & Noordermeer, E. 2007, MNRAS, 379, 702 [NASA ADS] [CrossRef] [Google Scholar]
- Sobouti, Y. 2007, A&A, 464, 921 [NASA ADS] [CrossRef] [EDP Sciences] [Google Scholar]
- Sobouti, Y. 2008a, unpublished [arXiv:0810.2198] [Google Scholar]
- Sobouti, Y. 2008b, unpublished [arXiv:0812.4127v2] [Google Scholar]
- Sobouti, Y. 2009, unpublished [arXiv:0903.5007] [Google Scholar]
- Sobouti, Y., Hasani Zonoozi, A., & Haghi, H. 2009, A&A, 507, 635 [NASA ADS] [CrossRef] [EDP Sciences] [Google Scholar]
- Stark, D. V., McGaugh, S. S., & Swaters, R. A. 2009, AJ, 138, 392 [NASA ADS] [CrossRef] [Google Scholar]
- Tiret, O., & Combes, F. 2009, A&A, 496, 659 [NASA ADS] [CrossRef] [EDP Sciences] [Google Scholar]
- Tully, R. B., & Fisher, J. R. 1977, A&A, 54, 661 [NASA ADS] [Google Scholar]
- Tully, R. B., & Verheijen, M. A. W. 1997, ApJ, 484, 145 [NASA ADS] [CrossRef] [Google Scholar]
- Wechsler, R. H., Bullock, J. S., Primack, J. R., Kravtsov, A. V., & Dekel, A. 2002, ApJ, 568, 52 [NASA ADS] [CrossRef] [Google Scholar]
All Tables
Best-fit reduced χ2 and M∗/L values of 32 HSB and 14 LSB galaxies in MOND with different interpolating functions, MOG, and NFW models.
Linear, M∗/L = (M∗/L)0 + mr, fit for 3 cases not well explained by either MOND3 formalism or by that of MOND1.
All Figures
|
Fig. 1 Rotation curves of 32 mainly HSB galaxies. The points with vertical error bars are the observed data. The dotted (black) and short dashed lines are contributions of the gaseous and stellar components to the Newtonian rotation speeds, respectively. The long dashed (blue) line is that of MOND1. The solid line is the rotation curve constructed through MOND3. The M∗/Ls of MOND3 are used in plotting the stellar component. The dashed-dotted (green) and dotted (red) lines are those of the MOG and NFW models, respectively. |
| In the text | |
|
Fig. 1 continued. The last seven galaxies have a bulge component, depicted as dashed-dotted lines. |
| In the text | |
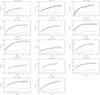 |
Fig. 2 Rotation curves of 14 LSB galaxies. Legend as in Fig. 1. |
| In the text | |
|
Fig. 3 Plots of M∗/L versus B − V. The solid line in each panel is the best fit to the prediction of the model in question. The slopes and y-intercepts of best-fitted lines are shown in the panels. Slopes of MOND1, MOND2, and MOND3 are reasonably close to the prediction of SPS, 1.74. That of MOG is not. Data points in NFW panel are much dispersed to conclude a meaningful correlation. In MOND1, MOND2, and MOND3 errors in the slopes, ±(0.23,0.21,0.26), respectively, are small enough to distinguish one model from the other. The errors in the y-intercepts, ±(0.12,0.14,0.15), respectively, are small enough to distinguish one IMF from the other. The other lines are the theoretical predictions of SPS with different IMFs (Bell & de Jong 2001, Bell et al. 2003). They are included here for comparison. They have almost the same slope, but different y-intercepts. |
| In the text | |
Current usage metrics show cumulative count of Article Views (full-text article views including HTML views, PDF and ePub downloads, according to the available data) and Abstracts Views on Vision4Press platform.
Data correspond to usage on the plateform after 2015. The current usage metrics is available 48-96 hours after online publication and is updated daily on week days.
Initial download of the metrics may take a while.