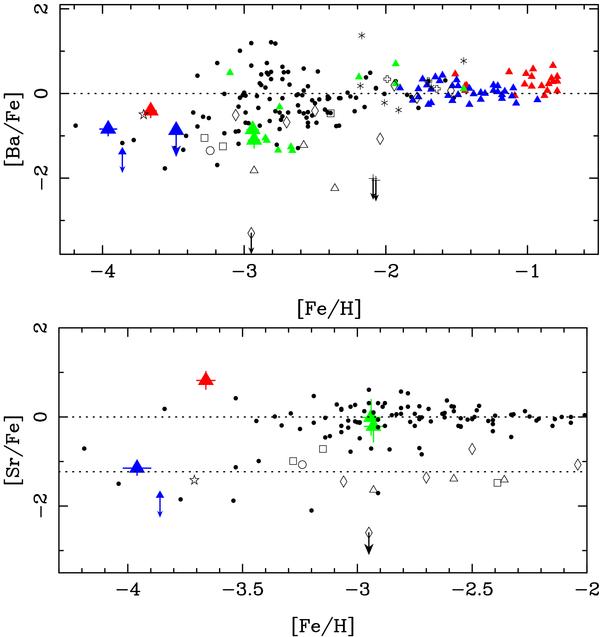
Fig. 14

Abundance ratios [Ba/Fe] and [Sr/Fe] as a function of [Fe/H]. General symbols are as in Fig. 9. From our initial comparison sample, we only keep the r-process only stars in the [Ba/Fe] plot. This requires to have measurements of the Eu abundance. This was possible with Lai et al. (2008); François et al. (2007); Honda et al. (2004); Aoki et al. (2005). We also inserted the sample of Milky Way halo stars of Barklem et al. (2005), similarly excluding carbon-rich and [Ba/Eu] > 0 (s-process enriched stars). As to the UFDs, we use the analysis and upper limits in [Ba/Fe] of Koch et al. (2008b) on Hercules (plus sign). In the case of Scl07-49, we could only estimate an upper limit for [Ba/H] in that we indicate with an arrow. Missing the blue part of its spectrum we could not measure its abundance in SrII. Data from Shetrone et al. (2001) in Ursa Minor are identified with small six-branches stars and. The Carina stars (crosses) at [Fe/H] > −2.5 are taken from Shetrone et al. (2003). The dotted line at [Sr/Fe] = −1.23 corresponds to the mean abundance ratio of the smallest dwarfs (fainter than Draco) and to the level of the Galatic halo stars for [Fe/H] ≤ −3.7.
Current usage metrics show cumulative count of Article Views (full-text article views including HTML views, PDF and ePub downloads, according to the available data) and Abstracts Views on Vision4Press platform.
Data correspond to usage on the plateform after 2015. The current usage metrics is available 48-96 hours after online publication and is updated daily on week days.
Initial download of the metrics may take a while.


