Fig. 11
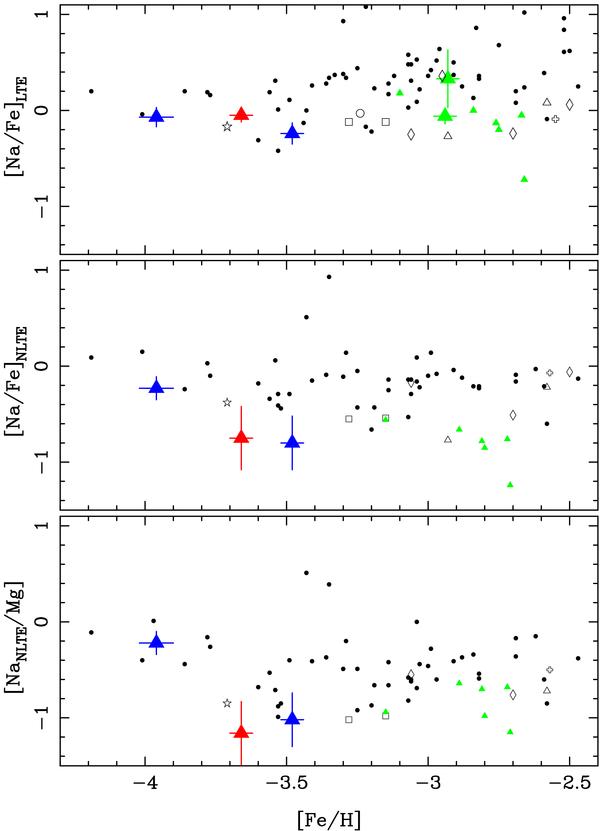
Upper panel: the [Na/Fe] versus [Fe/H] relation in LTE calculations. Middle panel: the relation between sodium, corrected for NLTE effects, and iron abundances. Lower panel: the relation between sodium corrected for NLTE effects, and magnesium as function of [Fe/H]. In the three panels, the symbols are as in Fig. 9.
Current usage metrics show cumulative count of Article Views (full-text article views including HTML views, PDF and ePub downloads, according to the available data) and Abstracts Views on Vision4Press platform.
Data correspond to usage on the plateform after 2015. The current usage metrics is available 48-96 hours after online publication and is updated daily on week days.
Initial download of the metrics may take a while.