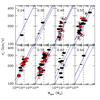
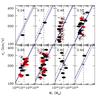
Fig. 21

The evolution of the σ-mass relation with redshift. Left: dynamical masses. Right: stellar masses. Colors and symbols as in Fig. 17. The numbers give the average redshift in each bin. The full lines show the best-fit relation σ = σC(M/MC)0.23 with uniform galaxy weighting, the dashed line with selection weighting. The blue lines show the reference line at zero redshifts. The vertical line indicates the MC = 2 × 10¹¹ M⊙ mass.
Current usage metrics show cumulative count of Article Views (full-text article views including HTML views, PDF and ePub downloads, according to the available data) and Abstracts Views on Vision4Press platform.
Data correspond to usage on the plateform after 2015. The current usage metrics is available 48-96 hours after online publication and is updated daily on week days.
Initial download of the metrics may take a while.