Fig. 12
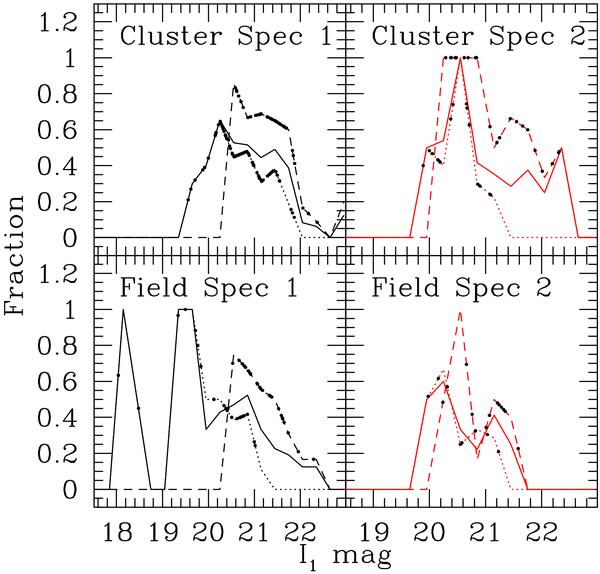
The relative completeness functions. The fraction of galaxies with an observed spectrum of spectroscopic type 1 or 2 for which we could measure velocity dispersions and obtain reliable photometric structural parameters. This relative completeness is shown for the clusters (top row) and the field (bottom row) as a function of galaxy magnitude in the I band in a 1 arcsec radius aperture. Colors code the spectral type (black: 1; red: 2). The full lines indicate the full redshift range, the dotted lines galaxies with z < 0.6, and the dashed lines galaxies with z ≥ 0.6. The dots show the magnitudes of the single galaxies and the assigned completeness weight.
Current usage metrics show cumulative count of Article Views (full-text article views including HTML views, PDF and ePub downloads, according to the available data) and Abstracts Views on Vision4Press platform.
Data correspond to usage on the plateform after 2015. The current usage metrics is available 48-96 hours after online publication and is updated daily on week days.
Initial download of the metrics may take a while.