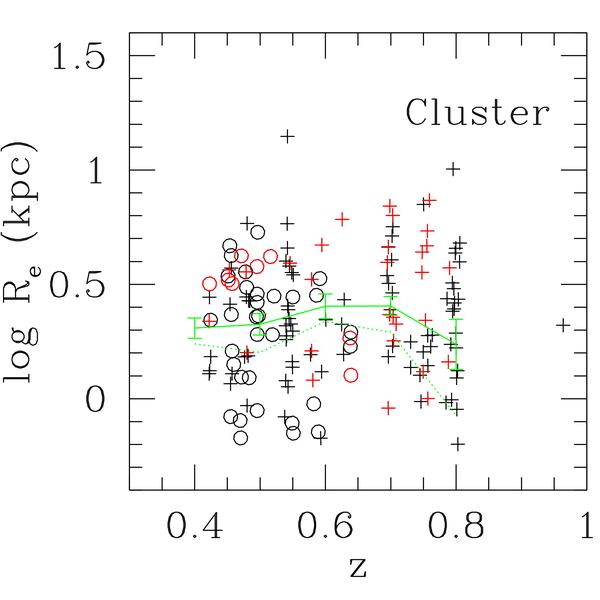
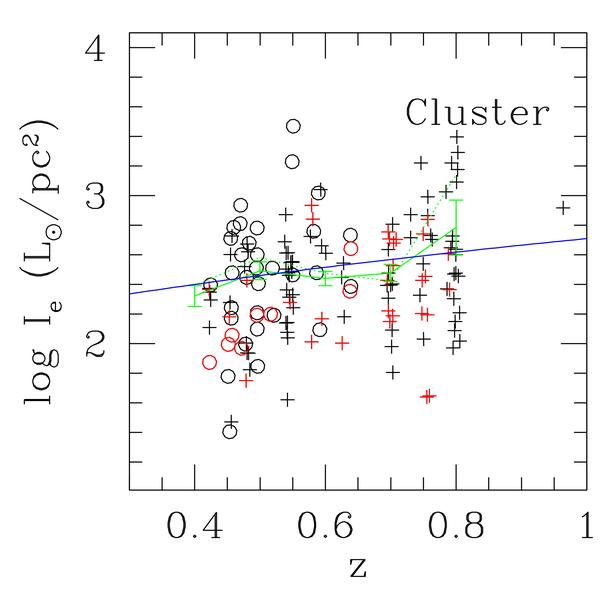
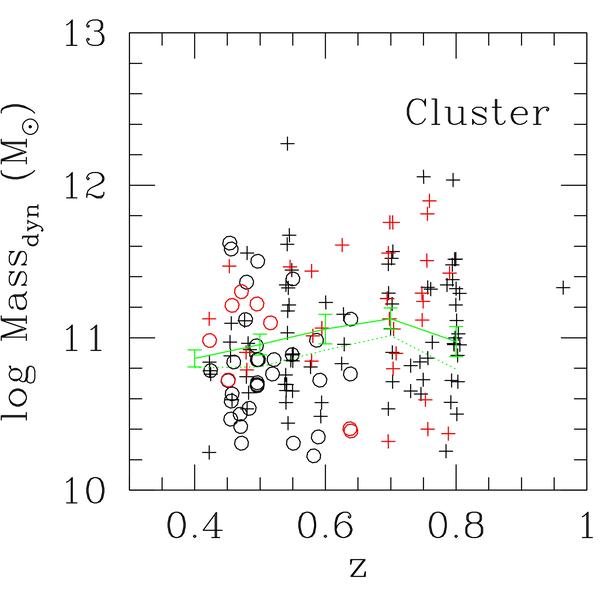
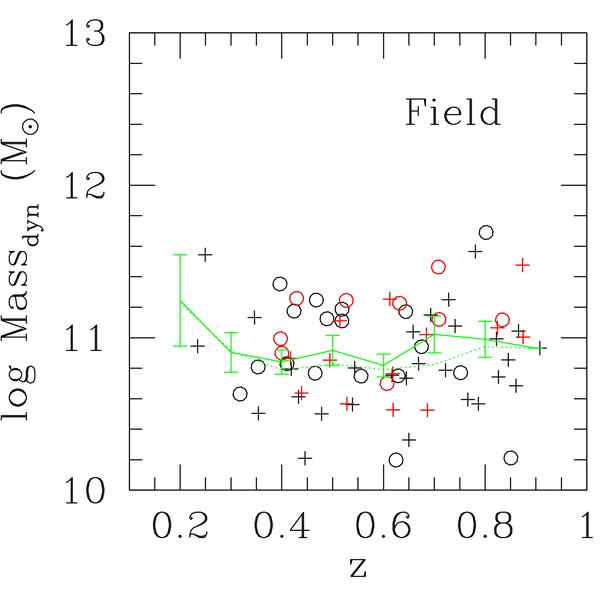
Fig. 10
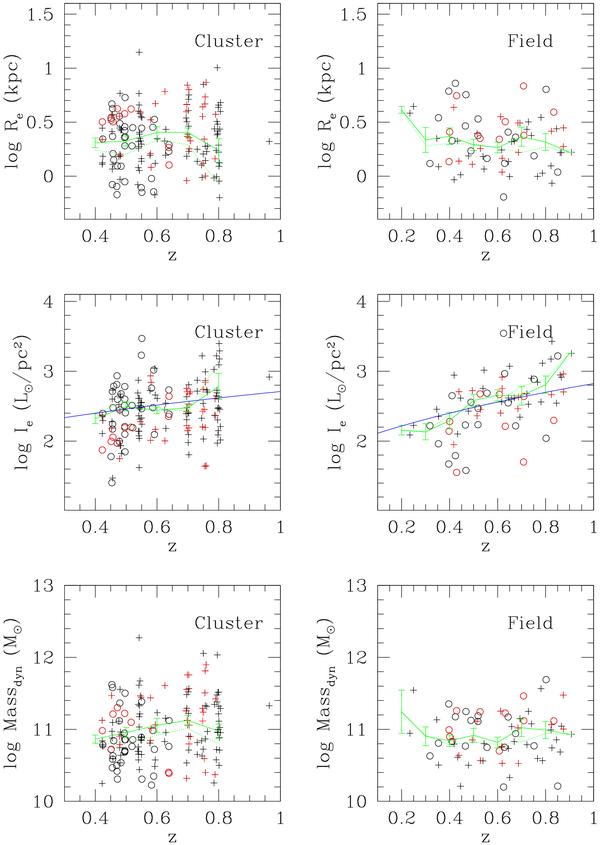
The distribution with redshift of sizes, surface luminosities, and dynamical masses
of the galaxy sample. We show the half-luminosity radii
log Re (top), effective surface
brightness log Ie (middle), and
dynamical mass log Mdyn (bottom) as a
function of redshift for cluster (left) and field
(right) galaxies. Black and red points show spectroscopic types 1
and 2, respectively. Crosses and circles show galaxies with HST and VLT photometry,
respectively. The solid green lines show the mean values in 0.1 redshift bins with
the errors. The dotted lines show the averages obtained by weighting each galaxy
with the inverse of its selection value. The blue lines show the mean luminosity
evolution derived from Fig. 17:
 for cluster galaxies and
 for the field.


Current usage metrics show cumulative count of Article Views (full-text article views including HTML views, PDF and ePub downloads, according to the available data) and Abstracts Views on Vision4Press platform.
Data correspond to usage on the plateform after 2015. The current usage metrics is available 48-96 hours after online publication and is updated daily on week days.
Initial download of the metrics may take a while.