Fig. 10
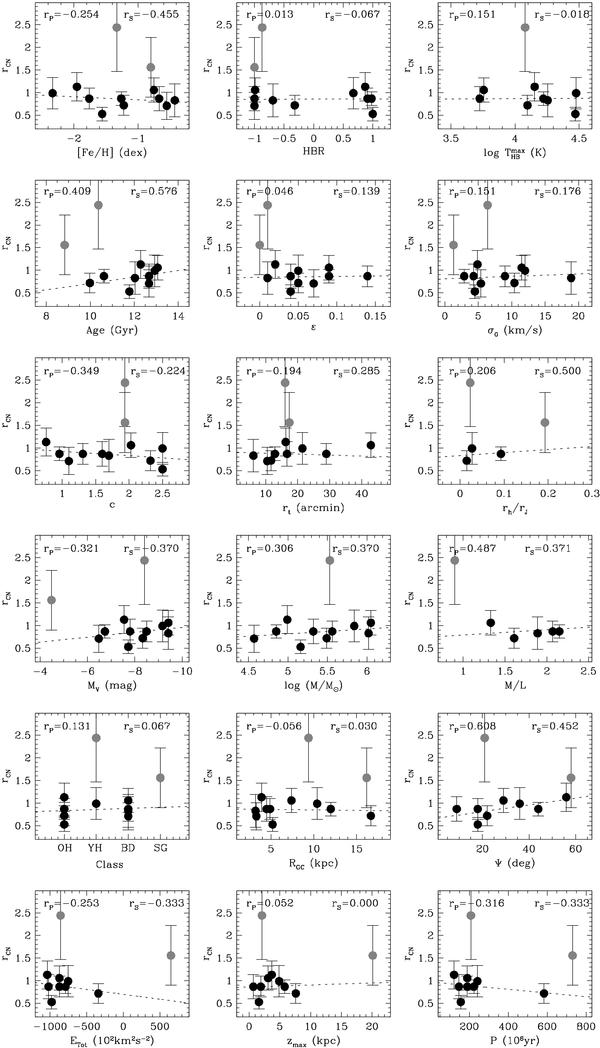
Run of the ratio rCN = nCNstrong/nCNweak for our sample clusters. In each panel, NGC 362 ans Pal 12 (grey dots) are excluded from the relations. Dotted lines mark linear fits to the remaining clusters (black dots) and the correlation coefficients are reported on top of each panel: rS stands for the Spearman and rP for the Pearson coefficient. For the meaning of X labels, see Tables 3 and 4.
Current usage metrics show cumulative count of Article Views (full-text article views including HTML views, PDF and ePub downloads, according to the available data) and Abstracts Views on Vision4Press platform.
Data correspond to usage on the plateform after 2015. The current usage metrics is available 48-96 hours after online publication and is updated daily on week days.
Initial download of the metrics may take a while.