Fig. B.1
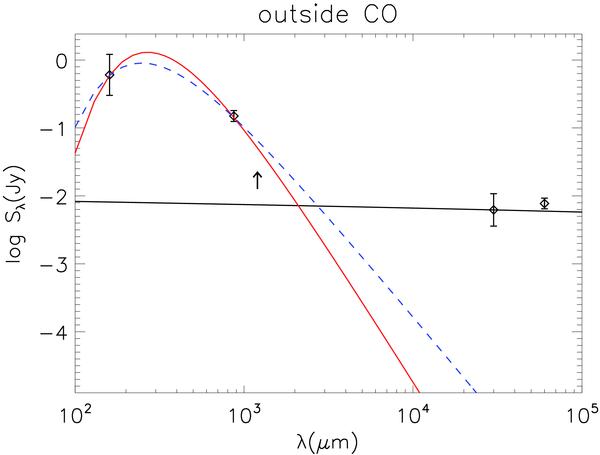
SED from the far-infrared to the radio, observed for the region outside the molecular clouds observed in CO. The fluxes observed at 160 μm and 870 μm are fitted with a single modified black-body with either an emissivity index of 1 (dashed blue line) or 2 (plain red line). Radio fluxes computed in the same regions are overplotted and the extrapolated free-free emission is displayed as a black line.
Current usage metrics show cumulative count of Article Views (full-text article views including HTML views, PDF and ePub downloads, according to the available data) and Abstracts Views on Vision4Press platform.
Data correspond to usage on the plateform after 2015. The current usage metrics is available 48-96 hours after online publication and is updated daily on week days.
Initial download of the metrics may take a while.