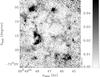
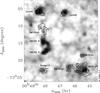
Fig. 1
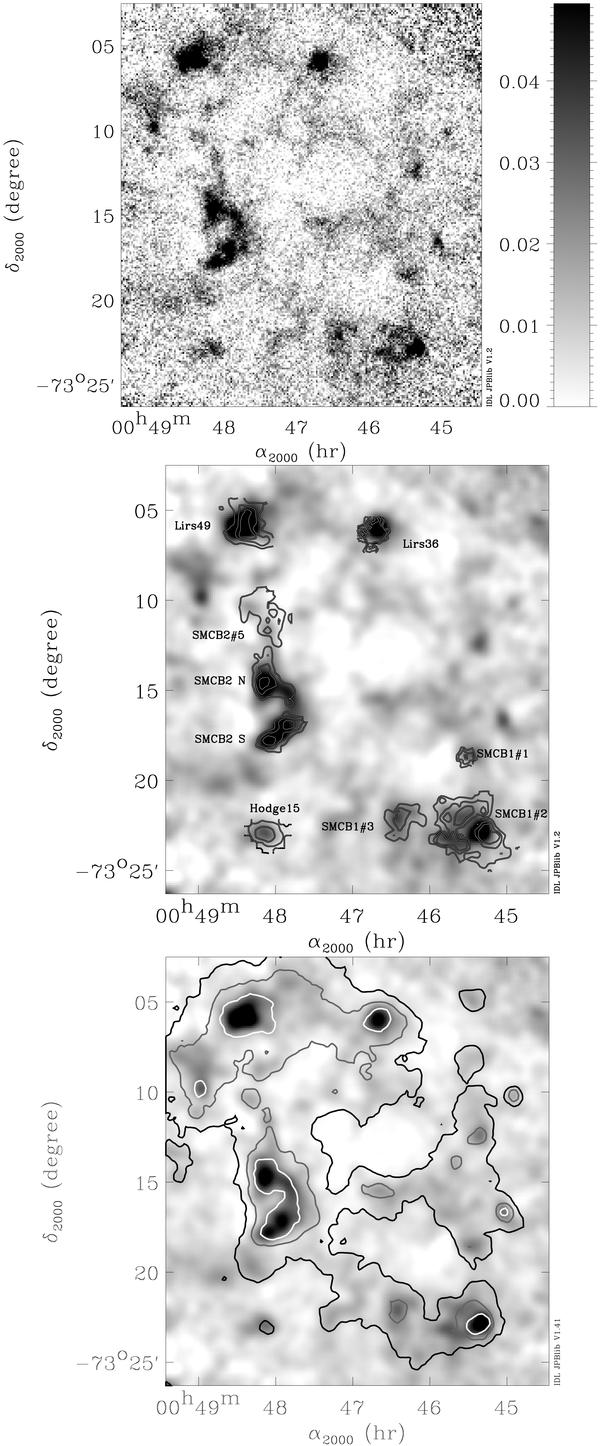
Top image: LABOCA image in the southwest region of the SMC (Units are in Jy/beam). Middle and bottom images: LABOCA images convolved to a ~40′′ resolution with CO and MIPS 160 μm contours overlaid, respectively. All the molecular clouds observed in CO are detected at 870 μm. Extended emission is well recovered in the LABOCA map and the 870 μm emission matches well the 160 μm one.
Current usage metrics show cumulative count of Article Views (full-text article views including HTML views, PDF and ePub downloads, according to the available data) and Abstracts Views on Vision4Press platform.
Data correspond to usage on the plateform after 2015. The current usage metrics is available 48-96 hours after online publication and is updated daily on week days.
Initial download of the metrics may take a while.