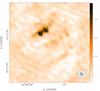
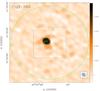
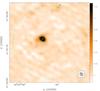
Fig. 2
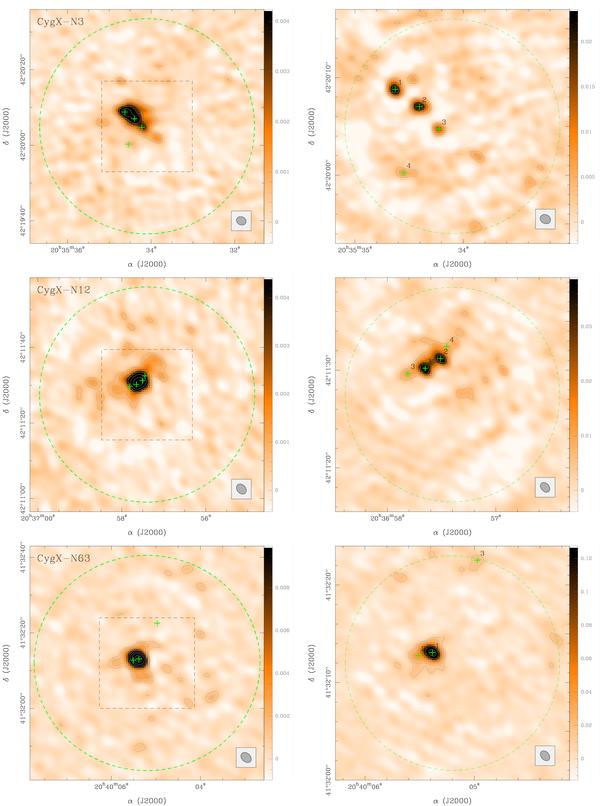
Maps of the continuum at 3.5 mm (left) and 1.3 mm (right) obtained with the PdBI for the three more isolated MDCs (see text). The color images have linear scales from −2σ to + 20σ for the 4 top panels, and from −3σ to + 30σ for the 2 lower ones where σ is the resulting rms in each field (see Table 1) (the unit on the right of the plots is Jy/beam). The (logarithmic) contour levels are 3σ, 4.8σ, 7.5σ, 12σ, 19σ, 30σ, 75σ, and 120σ. The crosses and numbers indicate the locations and the names of the fragments at 1 mm (see Table 2). The synthetised beams are displayed in the bottom right corners. The dashed circles indicate the primary beams. In the 3.5 mm maps (left), the name of the MDC is given, and the dashed squares indicate the areas covered at 1.3 mm (right). Note the similar behavior of the 3 MDCs. A compact core is observed at 3.5 mm that separates into smaller fragments at 1.3 mm. CygX-N63 seems to actually correspond to a single object down to the 1′′ (1700 AU) spatial resolution.
Current usage metrics show cumulative count of Article Views (full-text article views including HTML views, PDF and ePub downloads, according to the available data) and Abstracts Views on Vision4Press platform.
Data correspond to usage on the plateform after 2015. The current usage metrics is available 48-96 hours after online publication and is updated daily on week days.
Initial download of the metrics may take a while.