Fig. 8
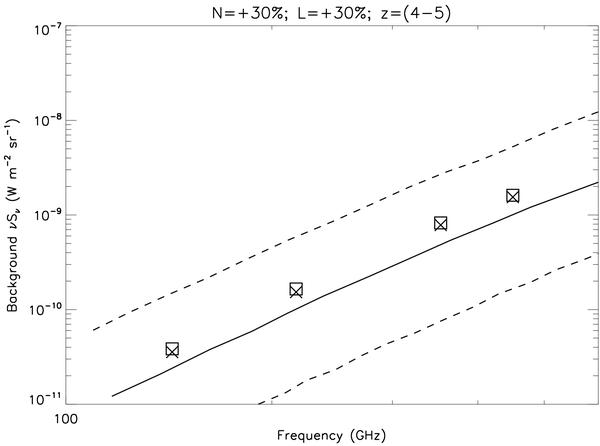
Comparison between the analytic form of the infrared background measured by FIRAS (Fixsen et al. 1998) and the modified FIRB models produced by incrementing by 30% the luminosity (crosses) or the number of sources (boxes) in the redshift range z = 4 − 5. The solid and dashed lines represent the most accurate estimation and the error at 1-σ in the FIRB spectrum obtained with FIRAS; the four boxes and crosses are the fluxes of the modified FIRB model at 143, 217, 353, and 450 GHz.
Current usage metrics show cumulative count of Article Views (full-text article views including HTML views, PDF and ePub downloads, according to the available data) and Abstracts Views on Vision4Press platform.
Data correspond to usage on the plateform after 2015. The current usage metrics is available 48-96 hours after online publication and is updated daily on week days.
Initial download of the metrics may take a while.