Fig. 7
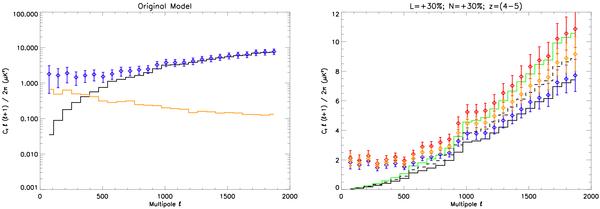
Angular power spectra obtained on the input maps of dust and FIRB and on the extracted maps. On the left, the yellow line is the dust spectrum computed on the input dust-only map; the black line represents the FIRB spectrum computed on the input map, using the original LDP model. The blue diamonds are the binned spectra computed on the extracted map. On the right, the comparison between the original LDP model and the modified ones when incrementing by 30% the luminosity or the number of sources in the redshift range z = 4−5. The dashed line illustrates the effect of increasing the luminosity of sources; the green line corresponds to an augmentation of 30% in the number of sources in the same redshift range; the solid line is the original FIRB spectrum. The yellow and red diamonds are the extracted spectrum for the two modified models, while the blue diamonds are for the original one. The error bars represent the 1-σ uncertainty in the computed binned spectra.
Current usage metrics show cumulative count of Article Views (full-text article views including HTML views, PDF and ePub downloads, according to the available data) and Abstracts Views on Vision4Press platform.
Data correspond to usage on the plateform after 2015. The current usage metrics is available 48-96 hours after online publication and is updated daily on week days.
Initial download of the metrics may take a while.