Free Access
Fig. 1
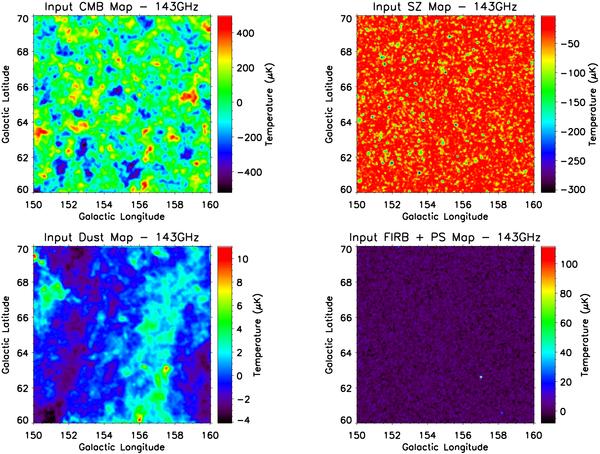
Input maps of the four components at 143 GHz. Signals are expressed in μK. At this frequency, apart from the largest clusters that produce an intense Sunyaev-Zel’dovic effect, the main contribution is due to CMB anisotropies.
Current usage metrics show cumulative count of Article Views (full-text article views including HTML views, PDF and ePub downloads, according to the available data) and Abstracts Views on Vision4Press platform.
Data correspond to usage on the plateform after 2015. The current usage metrics is available 48-96 hours after online publication and is updated daily on week days.
Initial download of the metrics may take a while.