Fig. 14
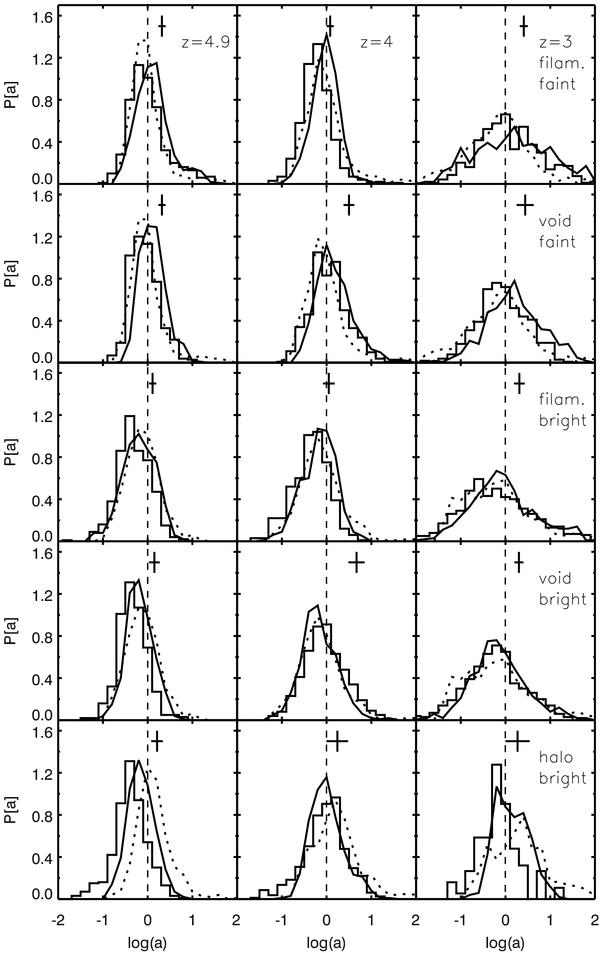
The distribution of the strength parameter log a of the proximity effect along the different lines of sight for the radiative transfer simulations (solid histogram), compared with RAM (dotted line) and the SAM (solid line). The mean a-values from the radiative transfer simulations Table 2) and their uncertainties are shown as vertical lines on top of each panel. The upper two panels show the low luminosity case. The lower three panels provide the results for the luminous QSO. From left to right, the redshifts are 4.9, 4, and 3. The vertical dashed line marks log a = 0.0.
Current usage metrics show cumulative count of Article Views (full-text article views including HTML views, PDF and ePub downloads, according to the available data) and Abstracts Views on Vision4Press platform.
Data correspond to usage on the plateform after 2015. The current usage metrics is available 48-96 hours after online publication and is updated daily on week days.
Initial download of the metrics may take a while.