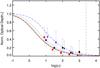
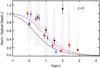
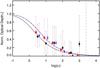
Fig. 12
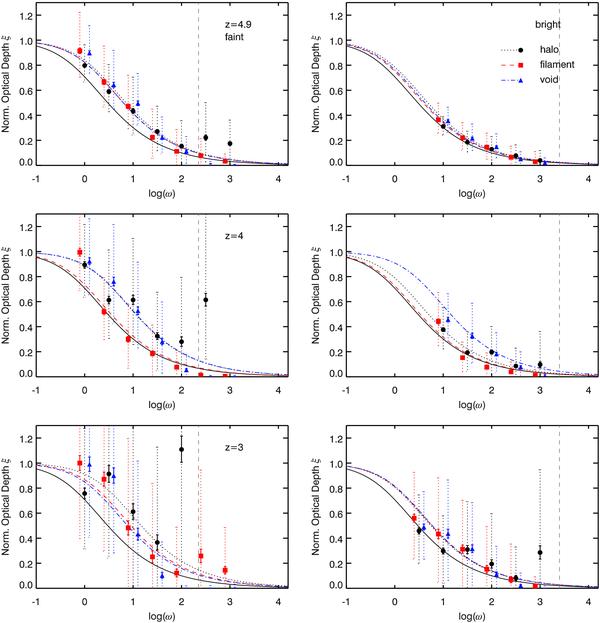
The combined proximity effect signature of all 500 lines of sight analysed with the BDO model showing the dependence on environment, luminosity, and redshift. The left column shows the case of a faint LνLL = 1031 erg Hz-1 s-1 QSO, the right one of a luminous LνLL = 1032 erg Hz-1 s-1 QSO. From top to bottom, redshifts are 4.9, 4, and 3. The solid lines show the geometrical dilution model, the other lines are best fits to the measurements with parameters given in Table 2. The circles and dotted lines show the halo cases, the squares and dashed lines the filament case and triangles and dash-dotted lines the void case. Symbols are horizontally shifted by ± 0.05 for better visibility. The dotted error bars show the sample 1σ standard deviation. The solid errors give the 2σ error in the mean. The dashed vertical line marks the start of the unreliability region of log ω ≥ 2.4 for the faint QSO and log ω ≥ 3.4 for the bright QSO.
Current usage metrics show cumulative count of Article Views (full-text article views including HTML views, PDF and ePub downloads, according to the available data) and Abstracts Views on Vision4Press platform.
Data correspond to usage on the plateform after 2015. The current usage metrics is available 48-96 hours after online publication and is updated daily on week days.
Initial download of the metrics may take a while.