Fig. 3
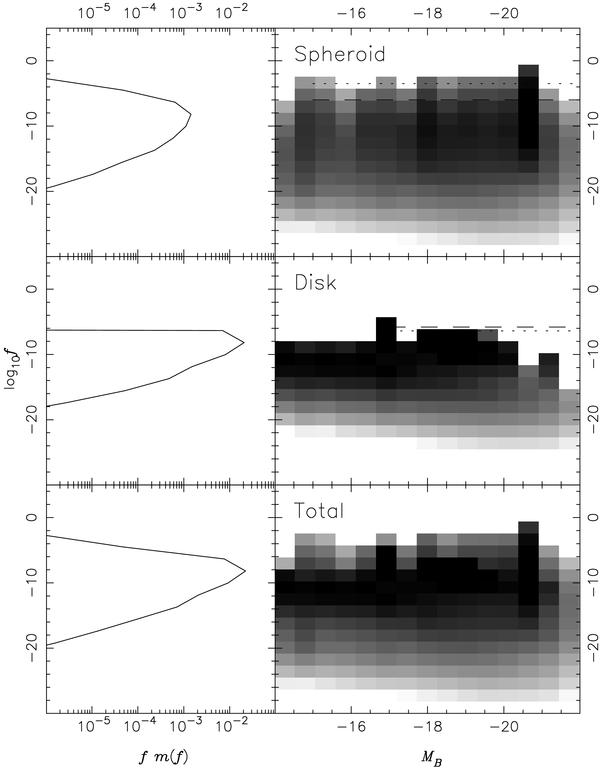
The phase density of stars in the local Universe as a function of the absolute magnitude of the galaxies that produce them, as derived from the Millennium Galaxy Catalogue. The panels show both the individual disk and spheroid components and the sum of the two. The projection of these plots by integrating over the distribution of galaxy luminosities shows the total stellar phase density of the local Universe. Here, f is expressed in M⊙pc-3(kms-1)-3 and m in pc3(kms-1)3Mpc-3. The dashed and dotted line show, respectively, the mean trend in effective and central phase density for components considered by Mao & Mo (1998).
Current usage metrics show cumulative count of Article Views (full-text article views including HTML views, PDF and ePub downloads, according to the available data) and Abstracts Views on Vision4Press platform.
Data correspond to usage on the plateform after 2015. The current usage metrics is available 48-96 hours after online publication and is updated daily on week days.
Initial download of the metrics may take a while.