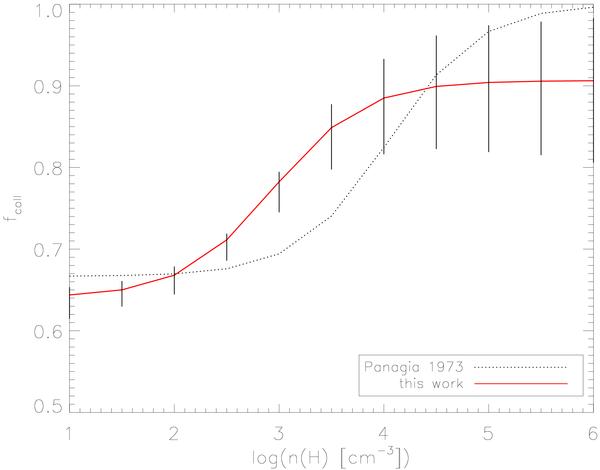
Fig. 11

fcoll factor accounting for the density effects. The red line represents the 3-parameter fit obtained on the basis of the photoionization modeling  to be used in formula (8) to calculate L(Lyα). At each density, vertical lines show the spread in
  values arising from the different Tbb and U models used: models with higher Tbb and lower U have higher
  values. The fit has been made for primordial nebular abundances and the black dotted line is fcoll from Panagia (1973).
Current usage metrics show cumulative count of Article Views (full-text article views including HTML views, PDF and ePub downloads, according to the available data) and Abstracts Views on Vision4Press platform.
Data correspond to usage on the plateform after 2015. The current usage metrics is available 48-96 hours after online publication and is updated daily on week days.
Initial download of the metrics may take a while.


