Fig. 8
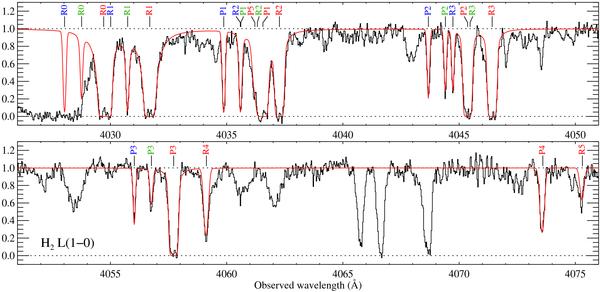
Portion of the UVES spectrum of J 1237 + 0647 covering the (1–0) Lyman band of H2. The labels indicate the branches (“R”, “P” for ΔJ = − 1, + 1, respectively) and the rotational levels of the lower states. Absorptions from different components are indicated by different label colours (#1: blue, #2: green, #3: red).
Current usage metrics show cumulative count of Article Views (full-text article views including HTML views, PDF and ePub downloads, according to the available data) and Abstracts Views on Vision4Press platform.
Data correspond to usage on the plateform after 2015. The current usage metrics is available 48-96 hours after online publication and is updated daily on week days.
Initial download of the metrics may take a while.