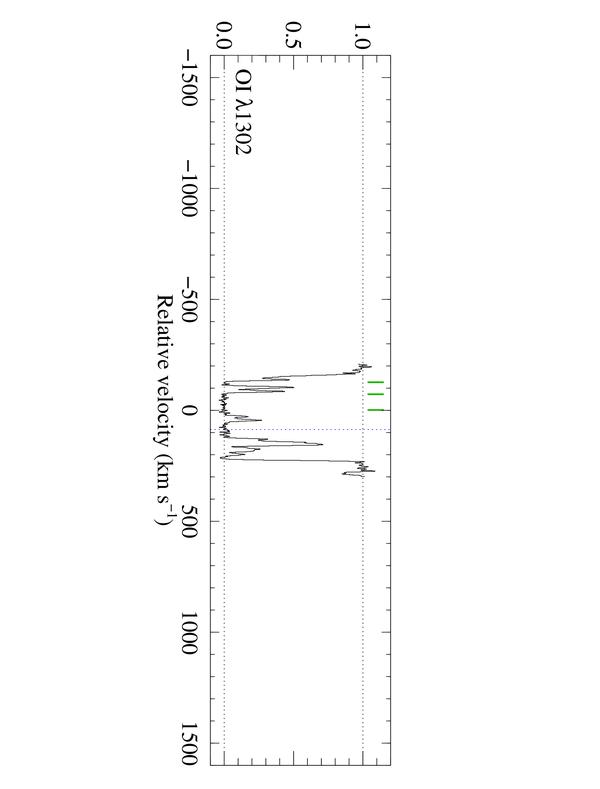
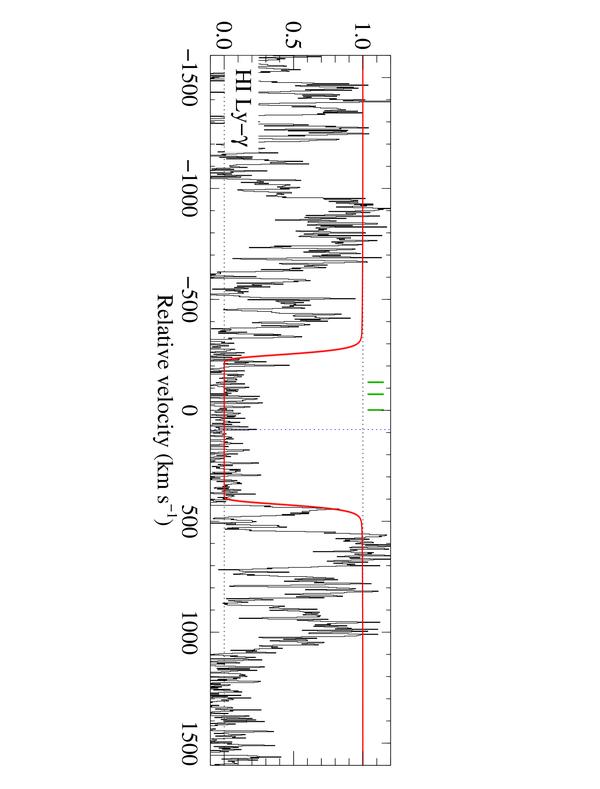
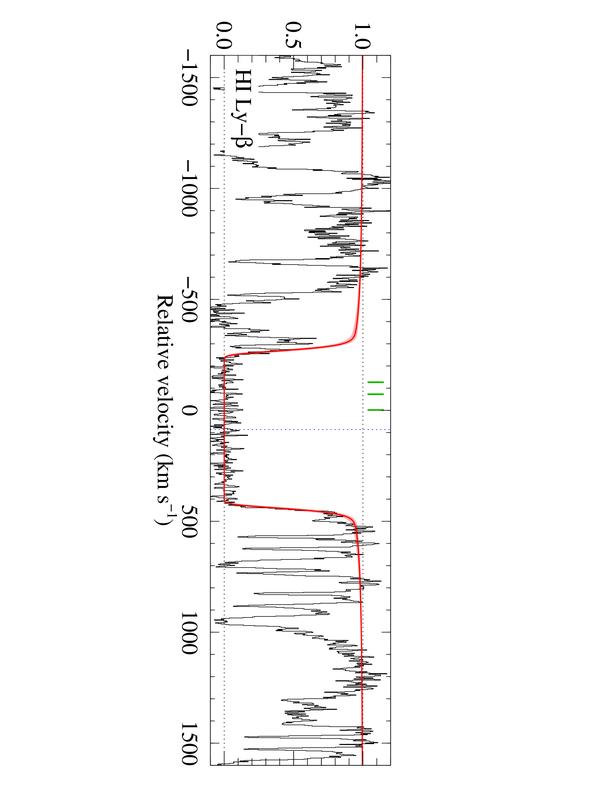
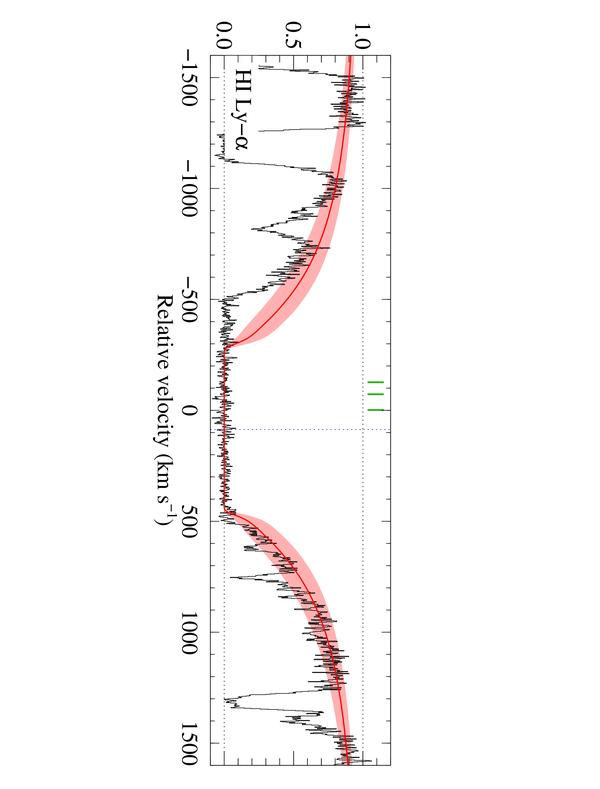
Fig. 2
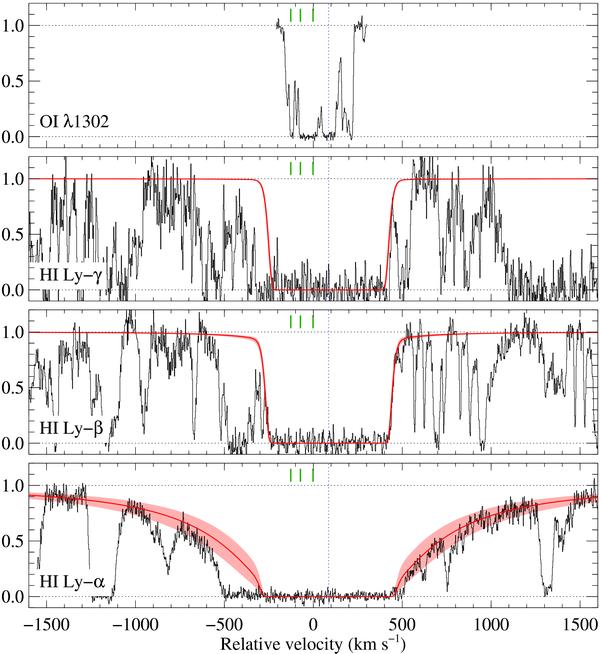
Measurement of the total column density of neutral atomic hydrogen at z = 2.69 towards J 1237 + 0647. The solid line represents the best one-component fit to the data. The centroid of the profile is indicated by a dotted vertical line. Uncertainties on the column density measurement are illustrated by the shaded area. The short tick marks indicate the position of the three H2-bearing components, the reddest of which also features CO and HD absorptions. The origin of the velocity scale for this figure and all following ones is defined at the position of the CO-bearing component at zabs = 2.68957.

Current usage metrics show cumulative count of Article Views (full-text article views including HTML views, PDF and ePub downloads, according to the available data) and Abstracts Views on Vision4Press platform.
Data correspond to usage on the plateform after 2015. The current usage metrics is available 48-96 hours after online publication and is updated daily on week days.
Initial download of the metrics may take a while.