Fig. 15
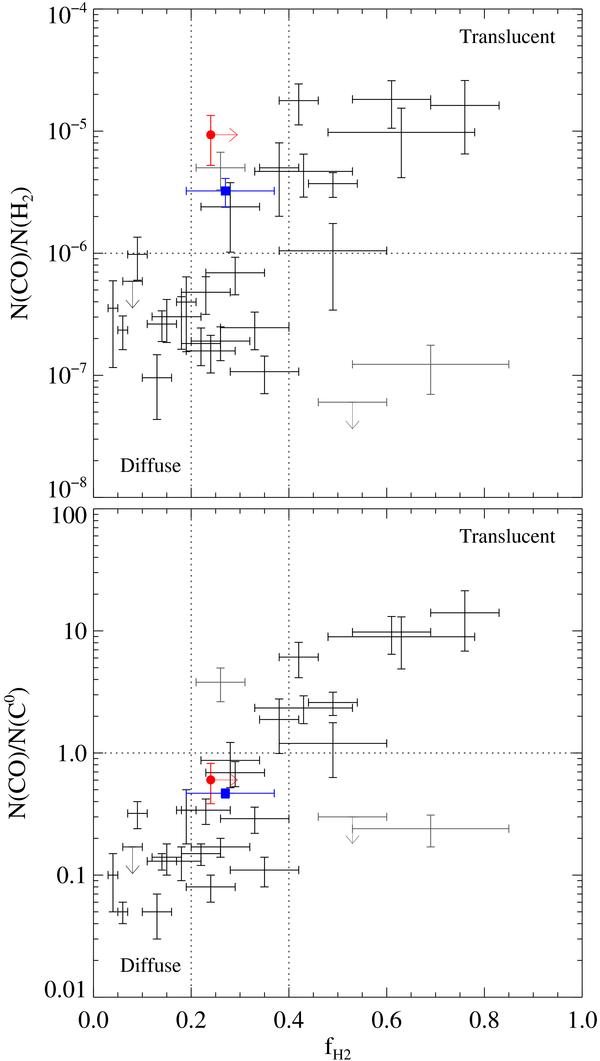
N(CO)/N(H2) and N(CO)/N(C0) versus the molecular fraction, fH2. The red filled circle with error bars is our measurement at z = 2.7 towards J 1237 + 0647, while the blue square represents the measurement at z = 2.4 towards J 1439 + 1117 (Srianand et al. 2008b). Other points represent measurements in the Galactic ISM with three outliers represented in grey (Burgh et al. 2010). These are peculiar systems with uncertain measurements by the same authors. The horizontal dotted line marks the limit between diffuse and translucent clouds, while the two vertical dotted lines mark the transition range between these two regimes. Note that the molecular fraction we indicates toward J 1237 + 0647 is a lower limit. In order to facilitate the comparison with local values, we use N(C0) measured with the f-values from Jenkins & Tripp (2001).
Current usage metrics show cumulative count of Article Views (full-text article views including HTML views, PDF and ePub downloads, according to the available data) and Abstracts Views on Vision4Press platform.
Data correspond to usage on the plateform after 2015. The current usage metrics is available 48-96 hours after online publication and is updated daily on week days.
Initial download of the metrics may take a while.