Fig. 12
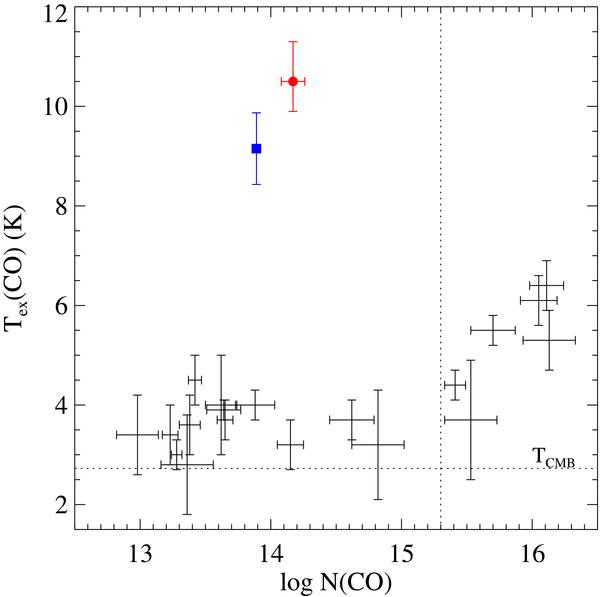
Excitation temperature of CO as a function of the total CO column density. Black error bars are measurements at z = 0 from Burgh et al. (2007). The red filled circle with error bars is our measurement at z = 2.7 towards J 1237 + 0647 while the blue square represents the measurement at z = 2.4 towards J 1439 + 1117 (Srianand et al. 2008b). Only a large range on Tex (6–16 K) could be determined for the system at z = 1.64 towards SDSS J160457.50 + 220300.5 (Noterdaeme et al. 2009a), and is therefore not represented in the figure. The vertical dotted line is indicative of a change of behaviour: below this limit there is no correlation between N(CO) and Tex(CO).
Current usage metrics show cumulative count of Article Views (full-text article views including HTML views, PDF and ePub downloads, according to the available data) and Abstracts Views on Vision4Press platform.
Data correspond to usage on the plateform after 2015. The current usage metrics is available 48-96 hours after online publication and is updated daily on week days.
Initial download of the metrics may take a while.