Fig. 11
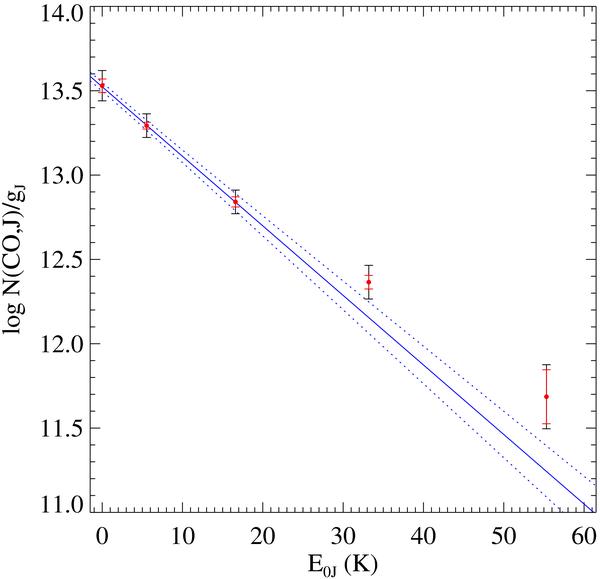
Excitation diagram of CO rotational levels. Errors on the column densities from fitting the lines are represented by the small red error bars while the long black error bars take into account the uncertainty in the continuum placement. The plain line represents the linear regression fit using J = 0 to J = 2 measurements and the best continuum fit. 1σ errors are represented by dashed lines.
Current usage metrics show cumulative count of Article Views (full-text article views including HTML views, PDF and ePub downloads, according to the available data) and Abstracts Views on Vision4Press platform.
Data correspond to usage on the plateform after 2015. The current usage metrics is available 48-96 hours after online publication and is updated daily on week days.
Initial download of the metrics may take a while.