Fig. 5
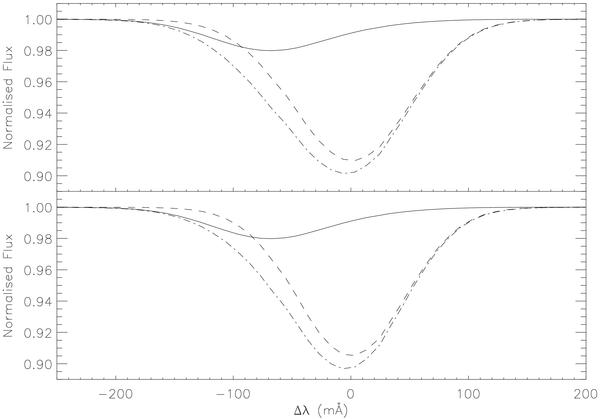
Synthetic spectra showing the effect of the Fe i blends on the 4934 Å Ba ii line. The top plot shows the r-process-only isotope fraction and the bottom shows the s-process-only isotope fraction. Solid line: the underlying Fe i blends. Dashed line: the uncontaminated Ba ii line. Dash-dot line: the overall line profile.
Current usage metrics show cumulative count of Article Views (full-text article views including HTML views, PDF and ePub downloads, according to the available data) and Abstracts Views on Vision4Press platform.
Data correspond to usage on the plateform after 2015. The current usage metrics is available 48-96 hours after online publication and is updated daily on week days.
Initial download of the metrics may take a while.