Fig. 10
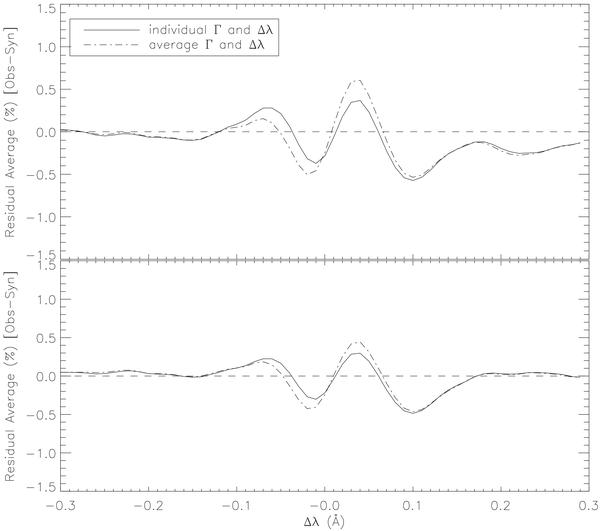
Average residuals for fits to 93 Fe lines, for two cases. It is quite clear that assuming a constant wavelength shift and macroturbulence is adequate when working in 1D LTE but assuming 1D LTE when dealing with high quality data is not. Top panel: the reduced-noise residual plot for all 93 lines. Bottom panel: the reduced-noise residual plot for 82 lines without other close absorption features. Lines not included in lower panel are noted with an asterisk in Table A.1.

Current usage metrics show cumulative count of Article Views (full-text article views including HTML views, PDF and ePub downloads, according to the available data) and Abstracts Views on Vision4Press platform.
Data correspond to usage on the plateform after 2015. The current usage metrics is available 48-96 hours after online publication and is updated daily on week days.
Initial download of the metrics may take a while.