Fig. 2
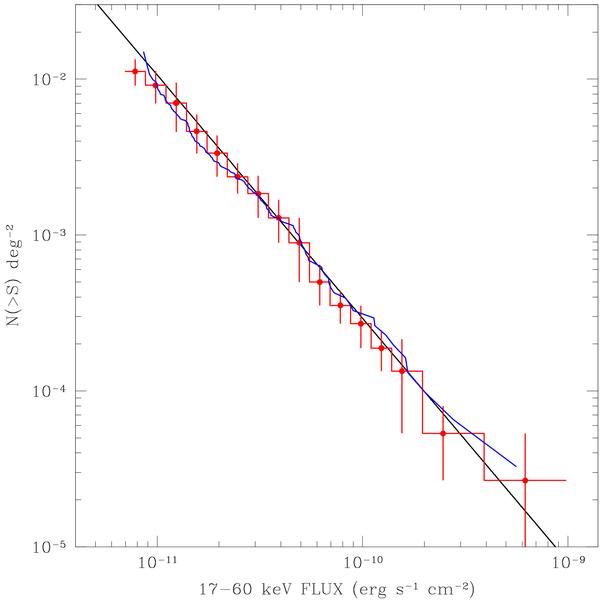
Number flux relation of extragalactic objects at |b| > 5° (red points) built from a nonblazar AGN sample containing 158 objects detected above 5σ. The best-fitting power law is shown by the black solid line. The blue curve represents AGN log N − log S measured by Ajello et al. (2009) with Swift/BAT.
Current usage metrics show cumulative count of Article Views (full-text article views including HTML views, PDF and ePub downloads, according to the available data) and Abstracts Views on Vision4Press platform.
Data correspond to usage on the plateform after 2015. The current usage metrics is available 48-96 hours after online publication and is updated daily on week days.
Initial download of the metrics may take a while.