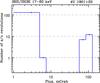
Fig. 1
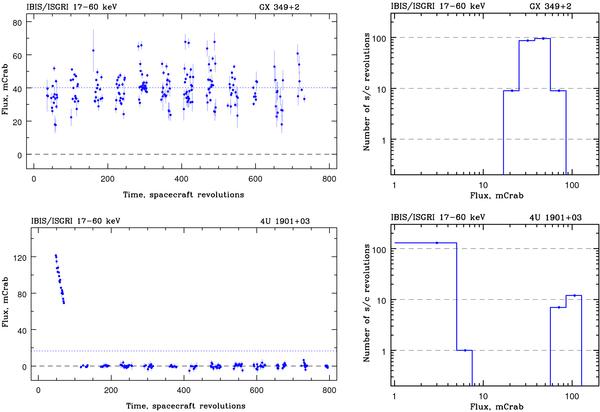
The 17 − 60 keV light curves (left) and histograms of the corresponding flux distribution (right) of two sources in the catalog: persistently detected and highly variable LMXB GX 349+2, and HMXB transient 4U 1901+03. The blue dotted lines in the left hand figures represent the flux of the sources measured on a 7-year time-averaged map. The first flux bin in the right histograms contains counts from the range [−5,5] mCrab, and the flux measurements with error > 5 mCrab were dropped.
Current usage metrics show cumulative count of Article Views (full-text article views including HTML views, PDF and ePub downloads, according to the available data) and Abstracts Views on Vision4Press platform.
Data correspond to usage on the plateform after 2015. The current usage metrics is available 48-96 hours after online publication and is updated daily on week days.
Initial download of the metrics may take a while.