Fig. 2
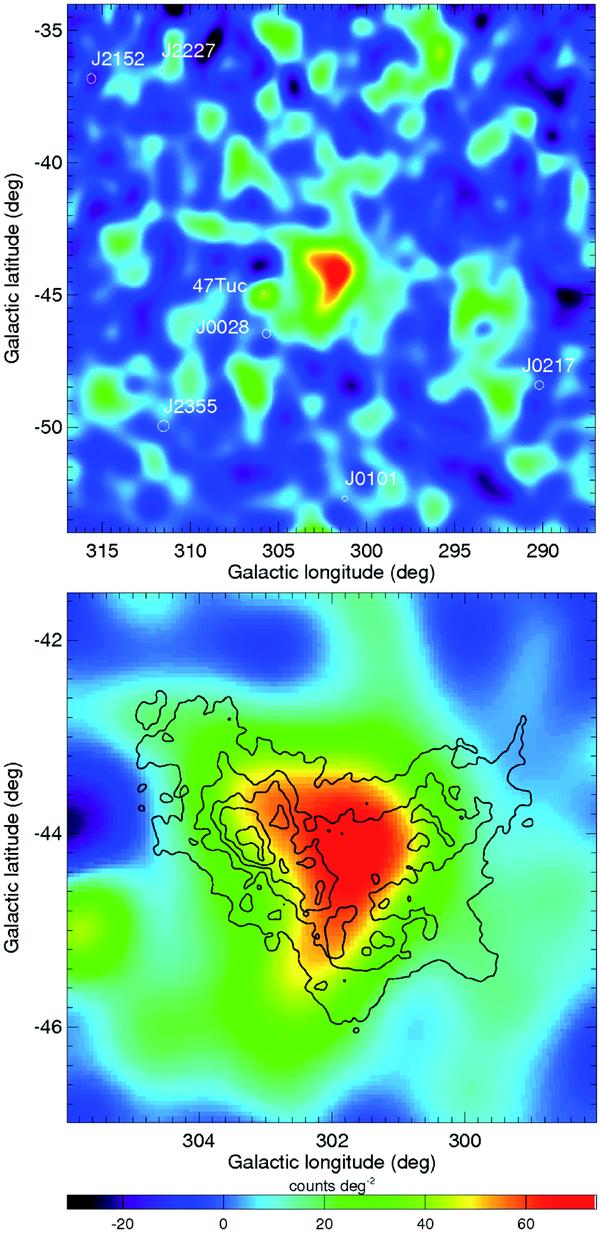
200 MeV−20 GeV residual counts maps after subtraction of the fitted celestial background model and a smoothing with a 2D Gaussian kernel with σ = 0.4°. Upper plot corresponds to the full region of interest and lower plot is a zoom on the SMC. The positions of the background point sources are marked by white circles in the top panel, with circle size indicating position uncertainty, and the SMC is traced by H I column density contours in the bottom panel.
Current usage metrics show cumulative count of Article Views (full-text article views including HTML views, PDF and ePub downloads, according to the available data) and Abstracts Views on Vision4Press platform.
Data correspond to usage on the plateform after 2015. The current usage metrics is available 48-96 hours after online publication and is updated daily on week days.
Initial download of the metrics may take a while.