Fig. 3
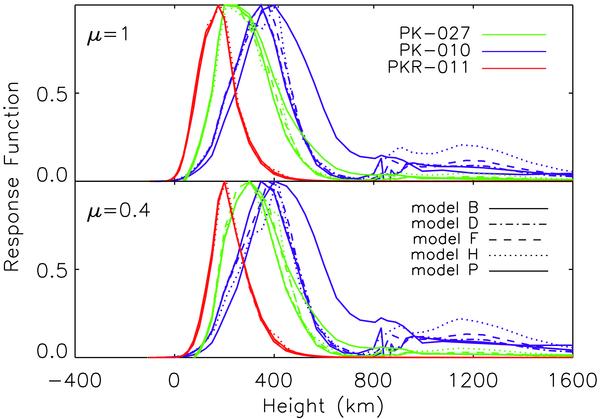
Intensity response functions to perturbations of temperature for the PSPT filters computed at the disk positions μ = 1 (top) and μ = 0.4 (bottom). The functions derived for the three filters and various atmosphere models are indicated by different colors and lines as specified in the legend. Each function is normalized to its maximum.
Current usage metrics show cumulative count of Article Views (full-text article views including HTML views, PDF and ePub downloads, according to the available data) and Abstracts Views on Vision4Press platform.
Data correspond to usage on the plateform after 2015. The current usage metrics is available 48-96 hours after online publication and is updated daily on week days.
Initial download of the metrics may take a while.