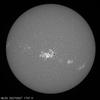
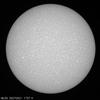
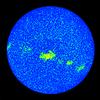
Fig. 2
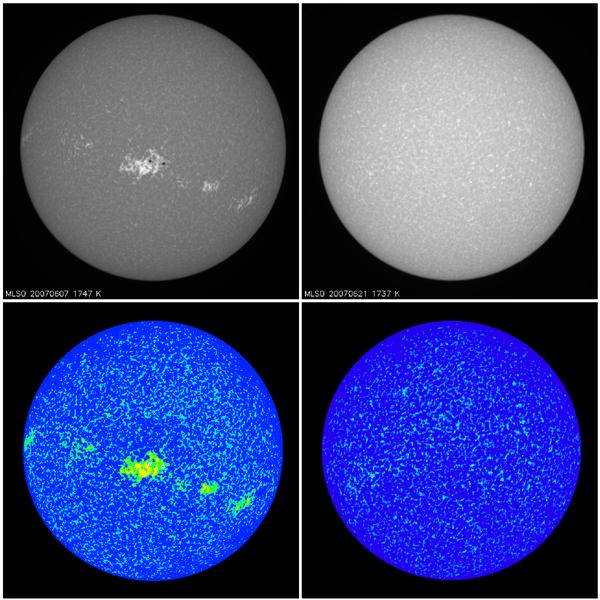
Example of PK-027 (top panels) observations analysed in this study and of the corresponding mask images (bottom panels). The observations were taken on 2007 June 7 (left side) and June 21 (right side). The disk features on mask images are identified by color: blue, light blue, green, and yellow show quiet Sun, network, enhanced network and plage regions, respectively; white and red show penumbral and umbral regions (visible only when enlarging the figure).
Current usage metrics show cumulative count of Article Views (full-text article views including HTML views, PDF and ePub downloads, according to the available data) and Abstracts Views on Vision4Press platform.
Data correspond to usage on the plateform after 2015. The current usage metrics is available 48-96 hours after online publication and is updated daily on week days.
Initial download of the metrics may take a while.